2. 中国农业大学资源与环境学院 北京 100193;
3. 山西省农业科学院旱地农业研究中心 太原 030031
2. College of Resources and Environmental Sciences, China Agricultural University, Beijing 100193, China;
3. Institute of Dryland Farming, Shanxi Academy of Agricultural Sciences, Taiyuan 030031, China
过量的人为氮排放导致的大气活性氮[主要包括NH3、NO2、HNO3、颗粒态NH4+(pNH4+) 和颗粒态NO3-(pNO3-)]污染和沉降已经成为世界范围内关注的问题[1]。随着中国社会经济的快速发展, 活性氮的排放以每年3.7%的速度递增, 到2010年中国排放的活性氮达56 Tg (1 Tg=1012 g)[2], 相应也导致大气NH3及NOx排放的急剧增加[3]。大量的活性氮排放使中国一些地区成为高氮沉降量的热点地区[4]。目前, 普遍认为中国农田过量施氮引起了严重的环境问题[5-6], 因此我国农业生态系统氮平衡问题受到了广泛关注。有研究指出农业是中国大气沉降氮的主要来源, 与20世纪80年代相比, 至2010年全国大气氮沉降增加了60%[7]。而我国氮沉降研究起步较晚, 从20世纪70年代才开始大气湿沉降的监测[8]; 到20世纪90年代, 全国性的沉降监测网络基本建立[9]; 2004年农田、草原、森林、城市等生态系统氮沉降监测陆续展开[10]。
我国现有氮沉降研究主要集中于对氮湿沉降的监测, 大气氮干沉降研究只有零星报道, 而且大多是针对大气某些氮化合物干沉降量和总沉降通量的研究[11-13], 缺乏对典型农区氮素干湿沉降多年连续监测结果。山西省是我国重要的能源基地, 同时大部分地区属于旱作农业区, 因此其大气活性氮的排放也具有特殊性, 但相关研究仍属于起步阶段。本研究选取山西省太原市阳曲县河村旱作农业区作为采样点, 使用DELTA系统、雨量器等仪器综合监测采样点大气活性氮污染状况, 并进一步探究其对干湿沉降的贡献。连续4年监测了山西省太原市近郊农田区域的大气活性氮状况, 定量化当地农田氮素的干、湿沉降输入。另外也明确活性氮组分之间的关系, 从而为估算和预测山西省乃至全国农业区中大气活性氮的沉降状况提供基础数据。
1 试验点和研究方法 1.1 采样点基本情况选取山西省太原市阳曲县凌井店乡河村旱作农业区 (112.89°E, 38.05°N) 作为采样点。该监测点位于太原市近郊北部30 km处, 年平均降水量为440 mm, 年平均气温10.1℃, 无霜期一般为120~140 d, 年均风速2.1 m∙s-1, 主要以西北风为主, 耕地451.4 hm2, 人口密度58人∙km-2, 完全依靠自然降水从事农业生产, 属于典型的农业村。采样期为2011年4月至2015年3月 (文中2011年为2011年4月—2012年3月, 2012年为2012年4月—2013年3月, 2013年为2013年4月—2014年3月, 2014年为2014年4月—2015年3月), 干沉降每月收集1次。干、湿沉降仪均放置在河村旱作农业基地, 周边农田主要粮食作物为玉米 (Zea mays), 平均施肥量240~275 kg (N2O)·hm-2、105~130 kg (P2O5)·hm-2, 采样区不存在其他污染源。
1.2 干沉降采样器干沉降采样器包括DELTA系统 (1套) 和被动采样器 (3个)。其中DELTA系统采集活性氮气体NH3、HNO3及颗粒态NH4+和NO3-, 被动采样器是用于活性氮气体NO2浓度的采集, 所采集的5种活性氮用于计算各形态氮及总的氮干沉降量。
1.2.1 DELTA系统DELTA系统是英国爱丁堡生态与水文中心 (Centre for Ecology and Hydrology, CEH) 开发的利用扩散管与滤膜组联用法长期监测NH3、HNO3、颗粒态NH4+和NO3-浓度的监测系统。DELTA系统实现了大气中气态NH3和HNO3与气溶胶的分开采集, 有效地减少了滤膜组测定法的误差。由于该系统价格相对低廉, 目前已在英国和欧洲的环境监测中得到了广泛应用[14]。在系统中配置一个小型的泵采集大气的速率为0.3~0.4 L∙min-1, 使进入的气体活性氮组分被采样链内扩散管上的吸附剂吸附, 气溶胶中颗粒物被后面的滤膜收集。其中采样链收集硝酸的吸附剂为1% KOH+1%甘油甲醇溶液, 吸附氨气的扩散管添加吸附剂为5%柠檬酸甲醇溶液, 收集颗粒物NO3-加吸附剂为5% KOH+10%甘油甲醇溶液, 收集颗粒物铵加吸附剂为13%柠檬酸甲醇溶液, 关于DELTA系统的更详细信息见参考文献[14]。采样高度高于地面1.6 m。由于中国空气污染严重, 本试验采用37 mm的滤膜来收集NO3-和NH4+颗粒物, 这个滤膜要大于欧洲监测所采用的25 mm的滤膜。
样品的采样周期为1个月, 即从1个月的月初到月末。样品从采样点采集后立即在4℃下保存, 且在1个月内分析完。HNO3和NO3-N颗粒物用10 mL 0.05% H2O2浸提, NH3和NH4+颗粒物用10 mL高纯水浸提, 溶解之后NO3-和NH4+在AA3连续流动分析仪上测定 (Bran+Luebbe GmbH, Norderstedt, Germany)。
1.2.2 用于大气NO2收集的被动采样器大气中NO2采用英国环境变化网络 (ECN) 所用的标准方法即被动采样器来采集, NO2被动采样器内部浸渍有20%的三乙醇胺吸附剂用于吸附NO2气体, 该采样器安置于距地面2 m, 每月采样时间为10~14 d, 时间与其他采样器同步进行, 该采样器在采样点采集两周后收回在4℃下保存, 采用ECN (www.ecn.ac.uk) 在线网站所描述的标准方法-比色法测定收集到的NO2浓度。
1.2.3 大气氮干沉降的计算大气氮素干沉降的计算采用推断模型法, 一定时间段内的大气氮干沉降量等于一段时间采集的大气活性氮浓度与沉降速率的乘积[15], 公式表示为:
| $F = C \times {V_d}$ | (1) |
式中:F表示一定时段的大气氮干沉降量[kg (N)∙hm-2], C表示一段时间的大气活性氮浓度[μg (N)·m-3], Vd表示不同活性氮种类的沉降速率[cm∙s-1]。
大气氮干沉降速率通常由大气沉降速率阻力模型获得, 不同的活性氮气体之间, 及气体和颗粒物均存在较大的差别。本研究中2011年4月—2013年3月选取Xu等[16]对华北地区氮沉降研究所发表的阳曲县农村区域沉降速率 (中国农业大学与北京大学合作研究模型计算得出), 由于沉降速率在年份间差异不大, 主要表现在月份间, 因此2013年4月—2015年3月采用前3年相应月份的平均沉降速率。各形态活性氮月沉降速率如表 1所示。
| 表1 华北地区不同年份各形态活性氮月平均干沉降速率 Table 1 Monthly average dry deposition velocities for NH3, HNO3, NO2, pNH4+, pNO3- in different years in North China |
雨水样品用雨量器 (SDM6, 天津产的气象设备) 在每次降雨事件后采集。雨量器紧邻Delta系统放在宽阔平坦的地方, 收集好的雨水冷冻保存并在1个月内分析完。NH4+-N和NO3--N用上面提到的方法测定。湿沉降的无机氮根据湿沉降中N的浓度和量来计算[17]
氮湿沉降的计算公式为:
| ${N_{{\rm{wd}}}} = P \times {C_{\rm{N}}} \times 10$ | (2) |
式中:
| ${N_{{\rm{m,y}}}} = \;\sum\nolimits_{\rm{1}}^n {{N_{{\rm{wd}}}} \times {{10}^{ - 3}}} $ | (3) |
式中:
所有试验数据均采用Microsoft Excel 2003软件处理并制图。
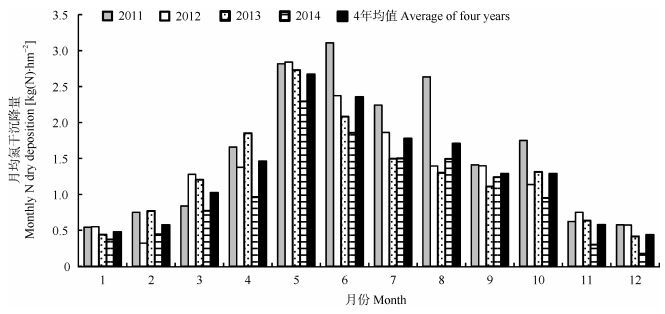
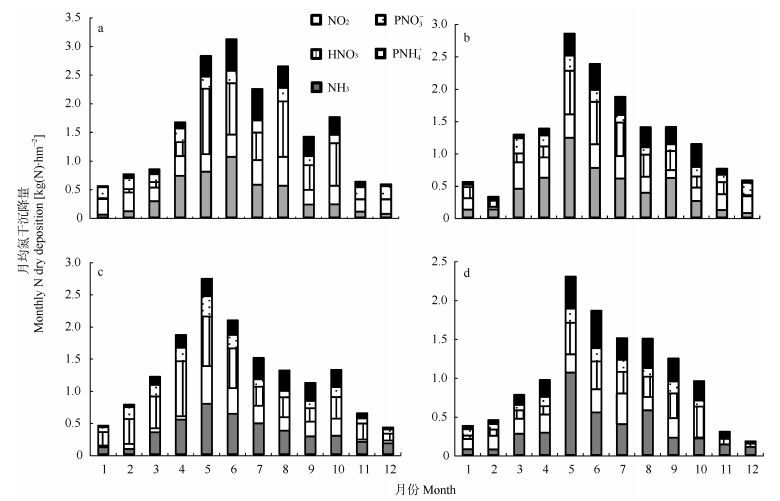
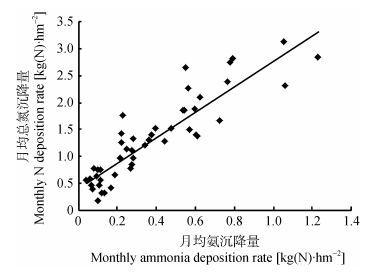
2 结果与分析 2.1 大气氮干沉降中各活性氮浓度及其沉降量月变化研究区大气NH3、HNO3、NO2、pNO3-和pNH4+ 4年平均浓度分别为4.17 μg (N)·m-3、1.49 μg (N)·m-3、6.10 μg (N)·m-3、2.58 μg (N)·m-3和4.10 μg (N)·m-3, NO2浓度在5种活性氮成分中最高; 由于气体和颗粒物的月沉降速率均存在较大差别, NH3、HNO3、NO2、pNO3-和pNH4+沉降量分别为4.50 kg (N)∙hm-2∙a-1、3.54 kg (N)∙hm-2∙a-1、2.56 kg (N)∙hm-2∙a-1、1.62 kg (N)∙ hm-2∙a-1和2.75 kg (N)∙hm-2∙a-1。本试验区氧化态氮 (HNO3、NO2和pNO3-) 沉降略高于还原态氮 (NH3和pNH4+), 二者之比为1.06。大气氮素干沉降通量为12.38~18.95 kg (N)∙hm-2∙a-1, 平均达14.98 kg (N)∙hm-2∙a-1, 占氮素年总沉降通量的28%~51%。就各活性氮的干沉降通量来看, 该试验点作为农区, 表现在气态NH3 > NO2, 颗粒物pNH4+ > pNO3-。图 1的年际间比较结果表明, 研究区4年各月以2011年的氮干沉降量最大, 2014年的最小。图 2显示除冬季3个月氮干沉降量较小外, 其他月份氮干沉降数量差别较小。该区氮干沉降通量除2011年外最大值出现在5月、6月份, 尤其以5月份出现最多, 而氨气峰值也出现在5月、6月份, 说明在施肥较为集中的5、6月份, 随之沉降的氮素也增多, 可知该区域氮的干沉降主要受农业施肥的影响。进一步分析表明, 2011—2015年各月氮干沉降量与氨气沉降量之间存在显著正相关, 总相关系数为0.8112(图 3), 说明本试验区氨气的沉降在活性氮沉降中占较大比重。尽管NO2沉降量次之, 但其与总活性氮沉降之间的相关性未达显著水平。由此可知, 该地区活性氮总沉降受农业氨气排放影响较大。
|
图 1 2011年4月—2015年3月研究区月平均大气氮干沉降量 Figure 1 Monthly average N dry deposition in the study area from April 2011 to March 2015 2011年为2011年4月—2012年3月, 2012年为2012年4月—2013年3月, 2013年为2013年4月—2014年3月, 2014年为2014年4月—2015年3月。 2011 is Apr. 2011-Mar. 2012; 2012 is Apr. 2012-Mar. 2013; 2013 is Apr. 2013-Mar. 2014; 2014 is Apr. 2014-Mar. 2015. |
|
图 2 2011年4月—2015年3月研究区不同形态活性氮的月均干沉降量 Figure 2 Monthly dry deposition of different reactive N forms in the study from April 2011 to March 2015 a为2011年4月—2012年3月, b为2012年4月—2013年3月, c为2013年4月—2014年3月, d为2014年4月—2015年3月。pNH4+和pNO3-分别为颗粒态NH4+和NO3-。 a: Apr. 2011-Mar. 2012; b: Apr. 2012-Mar. 2013; c: Apr. 2013-Mar. 2014; d: Apr. 2014-Mar. 2015. pNH4+ and pNO3- are NH4+, NO3- in particle form, respectively. |
|
图 3 2011年4月—2015年3月研究区氨月均沉降量与氮月均总沉降量之间关系 Figure 3 Relationship between monthly ammonia deposition rate and total N deposition rate from Apr. 2011 to Mar. 2015 in the study area |
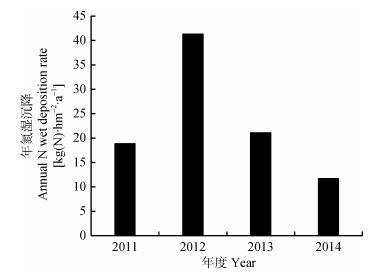
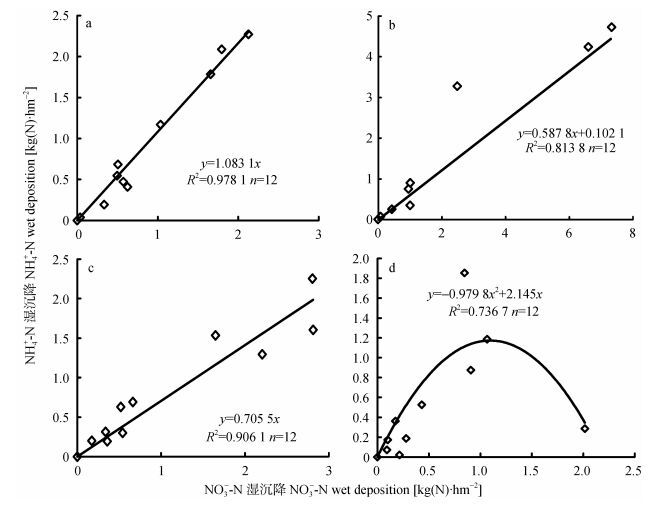
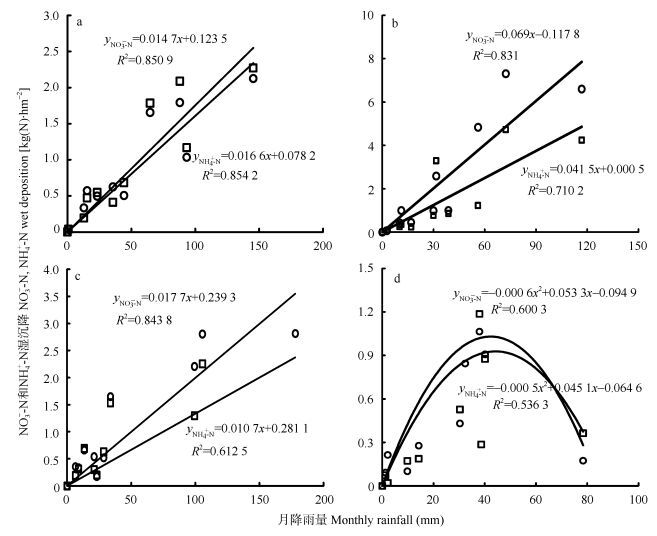
一直以来人们对湿沉降关注较多, 研究者发现氮湿沉降与降雨量密切相关, 且不同年份之间差别较大。河村2011—2015年降雨量为285.25~523.87 mm, 雨水中NO3-和NH4+平均浓度分别为3.20 mg (N)·L-1和2.43 mg (N)·L-1, 大气无机态氮湿沉降量为11.67~ 41.31 kg (N)∙hm-2∙a-1, 其中NO3--N沉降量占39%~51%, NH4+-N沉降量占49%~61%, 且以2012年氮素年湿沉降量最高, 2014年最低 (图 4), 4年氮湿沉降量占各自年总氮沉降量的49%~72%。本监测点为干旱农区, 但从占氮总沉降的份额看, 湿沉降量超过50%, 其旱作区特征不太明显。图 5显示2011—2013年每月沉降的NO3--N和NH4+-N之间显著正线性相关, 而2014年这种关系变为二次相关关系。图 6进一步表明4年中降雨量分别与NO3--N和NH4+-N呈显著正线性相关或二次相关关系, 相关系数平均分别达0.7815和0.6783, 说明NO3--N和NH4+-N的2/3以上的沉降量取决于降雨量大小。
|
图 4 2011年4月—2015年3月研究区年氮素湿沉降变化 Figure 4 N wet deposition in the study area from Apr. 2011 to Mar. 2015 2011年为2011年4月—2012年3月, 2012年为2012年4月—2013年3月, 2013年为2013年4月—2014年3月, 2014年为2014年4月—2015年3月。 2011: Apr. 2011-Mar. 2012; 2012: Apr. 2012-Mar. 2013; 2013: Apr. 2013-Mar. 2014; 2014: Apr. 2014-Mar. 2015. |
|
图 5 2011年4月—2015年3月研究区雨水中NO3--N和NH4+-N月沉降量之间关系 Figure 5 Relationship between monthly nitrate and ammonia deposition in rainfall from Apr. 2011 to Mar. 2015 a为2011年4月—2012年3月, b为2012年4月—2013年3月, c为2013年4月—2014年3月, d为2014年4月—2015年3月。 a: Apr. 2011-Mar. 2012; b: Apr. 2012-Mar. 2013; c: Apr. 2013-Mar. 2014; d: Apr. 2014-Mar. 2015 |
|
图 6 2011年4月—2015年3月研究区湿沉降中NO3--N和NH4+-N月沉降量分别与降雨量间关系 Figure 6 Relationship between monthly nitrate or ammonia deposition and rainfall from Apr. 2011 to Mar. 2015 a为2011年4月—2012年3月, b为2012年4月—2013年3月, c为2013年4月—2014年3月, d为2014年4月—2015年3月。 a: Apr. 2011-Mar. 2012; b: Apr. 2012-Mar. 2013; c: Apr. 2013-Mar. 2014; d: Apr. 2014-Mar. 2015 |
大气氮干沉降是大气氮沉降的重要组成部分, 其在欧洲占氮沉降量的10%~90%[18]。随着研究方法的成熟和重视程度加大, 近些年我国各地陆续开始了对干沉降的研究。本研究结果表明, 山西省太原市阳曲县凌井店乡河村旱作农业区2011年4月—2015年3月4年大气氮素干沉降通量平均达14.98kg (N)∙hm-2∙a-1, 占氮素年总沉降通量的28%~ 51%。监测期内干沉降呈逐年下降趋势, 可能与近两年玉米价格走低, 农民施肥量投入减少有关。4年各月氮干沉降量与氨气沉降量之间存在显著正相关, 相关系数为0.8112, 且氨气峰值出现在施肥较为集中的5、6月份。一般认为大气中NH4+-N主要来自土壤、肥料和家畜粪便中NH4+-N的挥发和含氮有机物的燃烧[19-20], NO3--N主要来自工业活动和汽车尾气的排放及氮的自然氧化 (如雷击)[21]。刘杰云等[22]也认为其他排放源如养殖场外和交通源释放的氨气一般在高温季7、8月份浓度较高。由此可知, 该区域氮的干沉降主要受氨气排放影响较大。Xu等[16]对全国大气活性氮的监测也得出类似的结论, 表明NH3和NO2的年排放量和各自的沉降量呈极显著的正相关。另外, 4年监测期间NH3/NO2的年均摩尔浓度比为1.9, 其比值 > 1, 说明农业源的贡献较大[23]。采样区周围没有任何厂矿污染源, 活性氮排放源单一, 综合考虑该区域农业施用氮肥对氮的干沉降影响较大。
虽然是旱作区, 该地区有些年份氮素干沉降低于湿沉降, 湿沉降占各自年总氮沉降量的49%~72%。而2010年在山西省古城镇的研究表明氮的干沉降是湿沉降的3倍[24], 陕西省不同生态区氮素沉降研究认为氮湿沉降占到62%以上[25-26]。此外, 与国内的一些研究相比, 本研究降雨中无机氮NO3-和NH4+平均浓度分别为3.20 mg (N)·L-1和2.43 mg (N)·L-1, 高于东部及南部的一些研究结果[27], 大气湿沉降除2012年外其余年份均低于广东肇庆森林采样点、浙江农田区域以及上海、广州等地[28-30]。相对于北方地区 (华北、东北、西北地区) 降雨输入的氮量5.1~25.4 kg (N)∙hm-2∙a-1而言, 本研究区有些年份高于上限值25.4 kg (N)∙hm-2∙a-1[31-34]。同其他研究者结果类似, 降雨量分别与NO3--N和NH4+-N呈显著的正线性相关或二次相关关系, 相关系数平均分别达0.7815和0.6783, 所以降雨量显著影响氮素的湿沉降[26, 35-36]。雨水中NO3--N和NH4+-N分别呈线性和二次正相关, 可以推测NO3--N和NH4+-N在雨水中以某种稳定的物质存在。
通过太原市郊区阳曲县河村 (4年) 大气氮输入的定期监测, 研究显示, 平均湿沉降NH4+-N、NO3--N及干沉降NH3、HNO3、NO2、pNH4+、pNO3-分别占沉降量的26.7%、33.4%、12.0%、9.4%、6.8%、7.3%和4.3%, 平均干沉降占总沉降量的39.9%。大气氮素干沉降量为12.38~18.95 kg (N)∙hm-2∙a-1, 湿沉降量为11.67~41.31 kg (N)∙hm-2∙a-1, 总沉降量平均值略低于全国43个点的平均大气氮干、湿沉降39.9 kg (N)∙ hm-2∙a-1[16], 也低于有的南方城市采样点, 例如雷州半岛典型农田大气氮沉降总量达42.9 kg (N)∙hm-2∙a-1[37]。但稍高于湖南亚热带地区森林, 农田的大气氮沉降 (包括干沉降和湿沉降) 为22~55 kg (N)∙hm-2∙a-1[15]。尽管有些地区显示湿沉降占90.4%以上[25], 但是, 随着人们对大气活性氮干沉降研究的逐渐增多, 已有研究结果表明氮素干沉降在其总沉降中占有很大比重[26], 本研究也证实这一结论。此外, 本研究大气氮素干沉降速率采用中国农业大学与北京大学合作研究模型计算得出, 相对于以前研究计算出的各活性氮干沉降量准确性更高些。总之, 4年大气氮总沉降平均值38.9 kg (N)∙ hm-2∙a-1已远超氮沉降对陆地生态系统影响警戒线10 kg (N)∙hm-2∙a-1, 目前该区域氮的沉降将会对农田生态系统养分循环产生较大影响[38-39]。本监测有助于该地区农田施用氮肥或监测氮素循环时合理估算大气输入的氮素。
| [1] | Compton J E, Harrison J A, Dennis R L, et al. Ecosystem services altered by human changes in the nitrogen cycle:A new perspective for US decision making[J]. Ecology Letters, 2011, 14(8): 804–815. DOI:10.1111/ele.2011.14.issue-8 |
| [2] | Cui S H, Shi Y L, Groffman P M, et al. Centennial-scale analysis of the creation and fate of reactive nitrogen in China (1910-2010)[J]. Proceedings of the National Academy of Sciences of the United States of America, 2013, 110(6): 2052–2057. DOI:10.1073/pnas.1221638110 |
| [3] | Liu X J, Duan L, Mo J M, et al. Nitrogen deposition and its ecological impact in China:An overview[J]. Environmental Pollution, 2011, 159(10): 2251–2264. DOI:10.1016/j.envpol.2010.08.002 |
| [4] | Galloway J N, Dentener F J, Capone D G, et al. Nitrogen cycles:Past, present, and future[J]. Biogeochemistry, 2004, 70(2): 153–226. DOI:10.1007/s10533-004-0370-0 |
| [5] | Gu B J, Ju X T, Chang J, et al. Integrated reactive nitrogen budgets and future trends in China[J]. Proceedings of the National Academy of Sciences of the United States of America, 2015, 112(28): 8792–8797. DOI:10.1073/pnas.1510211112 |
| [6] |
张卫峰, 马林, 黄高强, 等.
中国氮肥发展、贡献和挑战[J]. 中国农业科学, 2013, 46(15): 3161–3171.
Zhang W F, Ma L, Huang G Q, et al. The development and contribution of nitrogenous fertilizer in China and challenges faced by the country[J]. Scientia Agricultura Sinica, 2013, 46(15): 3161–3171. DOI:10.3864/j.issn.0578-1752.2013.15.010 |
| [7] | Liu X J, Zhang Y, Han W X, et al. Enhanced nitrogen deposition over China[J]. Nature, 2013, 494(7438): 459–462. DOI:10.1038/nature11917 |
| [8] |
鲁如坤, 史陶钧.
金华地区降雨中养分含量的初步研究[J]. 土壤学报, 1979, 16(1): 81–84.
Lu R K, Shi T J. The content of plant nutrients of precipitation in Jin-hua District of Zhejiang Province[J]. Acta Pedologica Sinica, 1979, 16(1): 81–84. |
| [9] |
丁国安, 徐晓斌, 王淑凤, 等.
中国气象局酸雨网基本资料数据集及初步分析[J]. 应用气象学报, 2004, 15(S): 85–94.
Ding G A, Xu X B, Wang S F, et al. Database from the acid rain network of China meteorological administration and its preliminary analyses[J]. Journal of Applied Meteorological Science, 2004, 15(S): 85–94. |
| [10] |
刘学军, 张福锁.
环境养分及其在生态系统养分资源管理中的作用:以大气氮沉降为例[J]. 干旱区研究, 2009, 26(3): 306–311.
Liu X J, Zhang F S. Nutrient from environment and its effect in nutrient resources management of ecosystems:A case study on atmospheric nitrogen deposition[J]. Arid Zone Research, 2009, 26(3): 306–311. |
| [11] |
王小治, 朱建国, 高人, 等.
太湖地区氮素湿沉降动态及生态学意义:以常熟生态站为例[J]. 应用生态学报, 2004, 15(9): 1616–1620.
Wang X Z, Zhu J G, Gao R, et al. Dynamics and ecological significance of nitrogen wet-deposition in Taihu Lake region-Taking Changshu agro-ecological experiment station as an example[J]. Chinese Journal of Applied Ecology, 2004, 15(9): 1616–1620. |
| [12] |
赵鹏, 朱彤, 梁宝生, 等.
北京郊区农田夏季大气颗粒物质量和离子成分谱分布特征[J]. 环境科学, 2006, 27(2): 193–199.
Zhao P, Zhu T, Liang B S, et al. Characteristics of mass dis-tributions of aerosol particle and its inorganic water soluble ions in summer over a suburb farmland in Beijing[J]. Environmental Science, 2006, 27(2): 193–199. |
| [13] |
许稳, 金鑫, 罗少辉, 等.
西宁近郊大气氮干湿沉降研究[J]. 环境科学, 2017, 38(4).
Xu W, Jin X, Luo S H, et al. Dry and bulk nitrogen deposition in suburbs of Xining City[J]. Environmental Science, 2017, 38(4). DOI:10.13227/j.hjkx.201609237 |
| [14] | Tang Y S, Simmons I, van Dijk N, et al. European scale ap-plication of atmospheric reactive nitrogen measurements in a low-cost approach to infer dry deposition fluxes[J]. Agricul-ture, Ecosystems & Environment, 2009, 133(3/4): 183–195. |
| [15] | Shen J L, Li Y, Liu X J, et al. Atmospheric dry and wet ni-trogen deposition on three contrasting land use types of an agricultural catchment in subtropical central China[J]. At-mospheric Environment, 2013, 67: 415–424. DOI:10.1016/j.atmosenv.2012.10.068 |
| [16] | Xu W, Luo X S, Pan Y P, et al. Quantifying atmospheric ni-trogen deposition through a nationwide monitoring network across China[J]. Atmospheric Chemistry and Physics, 2015, 15: 12345–12360. DOI:10.5194/acp-15-12345-2015 |
| [17] | Liu X J, Ju X T, Zhang Y, et al. Nitrogen deposition in agroecosystems in the Beijing area[J]. Agriculture, Ecosys-tems & Environment, 2006, 113(1/4): 370–377. |
| [18] | Erisman J, Hensen A, Fowler D, et al. Dry deposition moni-toring in Europe[J]. Water, Air and Soil Pollution:Focus, 2001, 1(5/6): 17–27. DOI:10.1023/A:1013105727252 |
| [19] | Dentener F J, Crutzen P J. A three-dimensional model of the global ammonia cycle[J]. Journal of Atmospheric Chemistry, 1994, 19(4): 331–369. DOI:10.1007/BF00694492 |
| [20] | Jenkinson D S. An introduction to the global nitrogen cy-cles[J]. Soil Use and Management, 1990, 6(2): 56–61. DOI:10.1111/sum.1990.6.issue-2 |
| [21] |
周薇, 王兵, 李钢铁.
大气氮沉降对森林生态系统影响的研究进展[J]. 中央民族大学学报:自然科学版, 2010, 19(1): 34–40.
Zhou W, Wang B, Li G T. Progress on the impact of atmospheric nitrogen deposition on forest ecosystems[J]. Journal of MUC:Natural Sciences Edition, 2010, 19(1): 34–40. |
| [22] |
刘杰云, 况福虹, 唐傲寒, 等.
不同排放源周边大气环境中NH3浓度动态[J]. 生态学报, 2013, 33(23): 7537–7544.
Liu J Y, Kuang F H, Tang A H, et al. Dynamics of atmospheric ammonia concentrations near different emission sources[J]. Acta Ecologica Sinica, 2013, 33(23): 7537–7544. |
| [23] | Xu W, Zheng K, Liu X J, et al. Atmospheric NH3 dynamics at a typical pig farm in China and their implications[J]. Atmos-pheric Pollution Research, 2014, 5(3): 455–463. DOI:10.5094/APR.2014.053 |
| [24] |
刘平, 刘学军, 骆晓声, 等.
山西北部农村区域大气活性氮沉降特征[J]. 生态学报, 2016, 36(17): 5353–5359.
Liu P, Liu X J, Luo X S, et al. The atmospheric deposition characteristics of reactive nitrogen (Nr) species in Shuozhou area[J]. Acta Ecologica Sinica, 2016, 36(17): 5353–5359. |
| [25] |
魏样, 同延安, 段敏, 等.
陕北典型农区大气干湿氮沉降季节变化[J]. 应用生态学报, 2010, 21(1): 255–259.
Wei Y, Tong Y A, Duan M, et al. Atmospheric dry and wet nitrogen deposition in typical agricultural areas of North Shaanxi[J]. Chinese Journal of Applied Ecology, 2010, 21(1): 255–259. |
| [26] |
梁婷, 同延安, 林文, 等.
陕西省不同生态区大气氮素干湿沉降的时空变异[J]. 生态学报, 2014, 34(3): 738–745.
Liang T, Tong Y A, Lin W, et al. Spatial-temporal variability of dry and wet deposition of atmospheric nitrogen in different ecological regions of Shaanxi[J]. Acta Ecologica Sinica, 2014, 34(3): 738–745. |
| [27] | Yang R, Hayashi K, Zhu B, et al. Atmospheric NH3 and NO2 concentration and nitrogen deposition in an agricultural catchment of Eastern China[J]. Science of the Total Envi-ronment, 2010, 408(20): 4624–4632. DOI:10.1016/j.scitotenv.2010.06.006 |
| [28] | Fang Y T, You M, Koba K, et al. Nitrogen deposition and forest nitrogen cycling along an urban-rural transect in southern China[J]. Global Change Biology, 2011, 17(2): 872–885. DOI:10.1111/gcb.2010.17.issue-2 |
| [29] |
陈义, 唐旭, 杨生茂, 等.
杭州稻麦菜轮作地区大气氮湿沉降[J]. 生态学报, 2009, 29(11): 6102–6109.
Chen Y, Tang X, Yang S M, et al. Atmospheric N wet depo-sition in Hangzhou region under rice-wheat-vegetable crop-ping system[J]. Acta Ecologica Sinica, 2009, 29(11): 6102–6109. DOI:10.3321/j.issn:1000-0933.2009.11.043 |
| [30] | Yu W T, Jiang C M, Ma Q, et al. Observation of the nitrogen deposition in the lower Liaohe River Plain, Northeast China and assessing its ecological risk[J]. Atmospheric Research, 2011, 101(1/2): 460–468. |
| [31] |
李生秀, 寸待贵, 高亚军, 等.
黄土旱塬降水向土壤输入的氮素[J]. 干旱地区农业研究, 1993, 11(S): 83–92.
Li S X, Cun D G, Gao Y J, et al. Mineral nitrogen introduced into soil by precipitation on Loess dry land[J]. Agricultural Research in the Arid Areas, 1993, 11(S): 83–92. |
| [32] |
吴刚, 冯宗炜, 王效科, 等.
黄淮海平原农林生态系统N、P、K营养元素循环——以泡桐-小麦、玉米间作系统为例[J]. 应用生态学报, 1993, 4(2): 141–145.
Wu G, Feng Z W, Wang X K, et al. N, P and K recyclings in an agroforestrial ecosystem of Huanghuaihai Plain:With Paulownia elongata-intercropped wheat and maize as an ex-ample[J]. Chinese Journal of Applied Ecology, 1993, 4(2): 141–145. |
| [33] |
罗良国, 闻大中, 沈善敏.
北方稻田生态系统养分平衡研究[J]. 应用生态学报, 1999, 10(3): 301–304.
Luo L G, Wen D Z, Shen S M. Nutrient balance in rice field ecosystem of northern China[J]. Chinese Journal of Applied Ecology, 1999, 10(3): 301–304. |
| [34] |
李世清, 李生秀.
陕西关中湿沉降输入农田生态系统中的氮素[J]. 农业环境保护, 1999, 18(3): 97–101.
Li S Q, Li S X. Nitrogen added to ecosystems by wet deposition in Guanzhong Area in Shaanxi[J]. Agro-Environmental Protection, 1999, 18(3): 97–101. |
| [35] |
张颖, 刘学军, 张福锁, 等.
华北平原大气氮素沉降的时空变异[J]. 生态学报, 2006, 26(6): 1633–1639.
Zhang Y, Liu X J, Zhang F S, et al. Spatial and temporal variation of atmospheric nitrogen deposition in North China Plain[J]. Acta Ecologica Sinica, 2006, 26(6): 1633–1639. |
| [36] |
郑祥洲, 张玉树, 丁洪, 等.
闽西北农田生态系统中大气氮湿沉降研究[J]. 水土保持学报, 2012, 26(3): 127–130.
Zheng X Z, Zhang Y S, Ding H, et al. Nitrogen wet-deposition in agro-ecosystem of northwestern Fujian Province[J]. Journal of Soil and Water Conservation, 2012, 26(3): 127–130. |
| [37] |
骆晓声, 石伟琦, 鲁丽, 等.
我国雷州半岛典型农田大气氮沉降[J]. 生态学报, 2014, 34(19): 5541–5548.
Luo X S, Shi W Q, Lu L, et al. Nitrogen deposition in typical cropland in the Leizhou Peninsula, China[J]. Acta Ecologica Sinica, 2014, 34(19): 5541–5548. |
| [38] | Krupa S V. Effects of atmospheric ammonia (NH3) on terrestrial vegetation:A review[J]. Environmental Pollution, 2003, 124(2): 179–221. DOI:10.1016/S0269-7491(02)00434-7 |
| [39] | Chan C K, Yao X H. Air pollution in mega cities in China[J]. Atmospheric Environment, 2008, 42(1): 1–42. DOI:10.1016/j.atmosenv.2007.09.003 |
 2017, Vol. 25


