2. 拜耳公司数字农业部 朗根费尔德 40764;
3. 西北农林科技大学黄土高原土壤侵蚀与旱地农业国家重点实验室 杨凌 712100;
4. 澳大利亚悉尼科技大学生命科学学院 悉尼 2007
2. Bayer AG, Digital Farming, Langenfeld 40764, Germany;
3. State Key Laboratory of Soil Erosion and Dryland Farming on the Loess Plateau, Northwest A & F University, Yangling 712100, China;
4. School of Life Sciences, University of Technology Sydney, Sydney 2007, Australia
水稻(Oryza sativa)是世界上最主要的粮食作物之一, 全球超过50%以上的人口以大米为主食。水稻主要在亚洲、拉丁美洲种植, 近年来在非洲等地的种植面积也逐渐增加[1]。中国是水稻生产的大国, 其种植面积占世界总种植面积的18.5%, 产量占世界水稻总产的28%[2-3]。由于水稻主要种植在亚热带区域, 生长季极易遭受高温热害, 从而造成水稻产量损失[4]。据研究, 过去30年高温热害造成中国水稻产量减少1.5%~9.7%[2, 5], 仅2003年的水稻扬花期高温热害就造成了长江中下游水稻受灾40.5万hm2[6-7]。高温热害不仅仅造成水稻产量下降, 还可能降低稻米直链淀粉含量, 影响稻米品质[8]。一些模型模拟的结果也指出, 由于气候变化, 尤其是温度升高造成中国水稻产量的波动性可能会更大[9]。伴随着气候变暖和极端高温灾害的频发[10-11], 高温热害已经成为水稻生产的一大威胁[12], 加强水稻高温热害研究对农业适应气候变化和农业防灾减灾具有重要意义。
揭示水稻高温热害的时空分布规律, 开展高温热害影响水稻产量的研究是农业适应气候变化的前提。目前关于水稻高温热害发生规律的研究主要集中在高温热害的时空分布、趋势变化、利用统计或者作物模型方法分析高温热害对产量的影响。在水稻高温热害时空分布特征方面, 万素琴等[13]分析了1961—2005年湖北的水稻高温热害时空分布规律, 认为20世纪60年代是一季稻高温热害发生最严重的时期, 在地域上表现为湖北东部多于西部, 且20%以上高温热害年份造成了3%以上的减产。于堃等[14]分析了江苏水稻高温热害时空规律发现2001—2007年为江苏高温热害最严重时段, 且主要发生在淮河以南地区。杨太明等[15]探究了皖浙地区水稻高温热害发生规律, 发现20世纪80年代中期以前高温热害的发生日数和次数均呈减少趋势, 其后则呈增多趋势。Shi等[2]研究了全国一季稻和双季早稻的高温热害分布规律, 发现长江中下游南部和中北部为高温热害最严重区域。谭诗琪等[16]对长江中下游的高温热害分布研究也得出了类似的结论。在水稻高温热害发生的趋势研究方面, Shi等[2]的研究认为从1981年到2010年, 大部分地区的高温热害有显著增加的趋势, 尤其在中国双季早稻区域的东部。此外, Huang等[17]发现江西超过80%的站点高温热害都有显著增加的趋势。无论是利用统计分析或者模型模拟方法, 高温热害对中国水稻产量都有不同程度的减产作用[18], 例如任义方等[19]表明日最高温度≥35 ℃的日数与水稻穗粒数显著相关, 杨太明等[15]发现高温热害与穗结实粒数和千粒重明显的负相关。由于气候变暖, 未来气候变化下中国水稻区域高温热害发生概率更高[20], 在不采取适应措施的情况下中国水稻产量可能下降[21-22]。
以上研究从省级尺度或者区域尺度揭示了历史水稻高温热害的发生规律及时空特征, 分析了产量与高温热害的关系。研究表明, 高温热害属于一种极端天气现象[10, 23], 类似于极端降水[24-25]、极端气温[26-28]一样也可能满足一定的概率分布, 在此提出我们的科学假设:是否水稻的高温热害也满足极值概率分布特征?揭示高温热害这种极端事件的概率分布特征对我们进一步认识高温热害发生规律有重要帮助, 尤其是对高温热害天气保险指数研制[29]具有重要意义。然而, 目前关于水稻高温热害的极值概率分布规律尚不清楚。
本文在总结其他学者关于水稻高温热害时空分布的研究基础上, 以中国早稻种植区为研究区域, 以趋势检验和极值概率分布统计理论为基础, 分析早稻区域历史高温热害空间分布和时间趋势特征, 探讨水稻高温热害极值概率分布规律, 以期为水稻生产适应气候变化和农业防灾减灾提供理论支撑。
1 材料和方法 1.1 研究区域和数据来源根据国家气象中心农业气象中心的农业气象业务指南[30], 中国早稻主要分布在江南和华南区域(图 1)。本研究选择早稻种植区域的214个气象站点作为研究站点, 气象数据来源于中国气象局国家气象中心气象数据库。计算早稻高温热害主要需要日最高气温和平均气温, 气象数据从1971到2015年, 共45年。考虑到部分气象站点缺少1971年前的观测数据, 因此统一设定各站点的研究时段从1971年开始, 确保早稻区域尽量多的站点参与计算。

|
图 1 早稻区域气象站点分布 Figure 1 Meteorological sites in the early rice area of China investigated in this study |
根据国家水稻高温热害指标[31]和相关文献[12], 选择生长季内日连续3 d最高温度≥35 ℃或平均温度≥30 ℃天数, 即高温热害累计天数(ADHS, accumulated days of heat stress)和热害有害积温(HDD, heat stress degree days, 超出35 ℃部分的累计值)作为水稻高温热害的两个指标。热害有害积温计算公式为:
| ${\text{HDD}} = \sum\limits_h^m {{\text{H}}{{\text{D}}_i}} $ | (1) |
| ${\text{H}}{{\text{D}}_i} = \left\{ \begin{gathered} 0{\text{ (}}{T_{\max i}} < 35) \hfill \\ {T_{\max i}} - 35{\text{ (}}{T_{\max i}} \geqslant 35){\text{ }} \hfill \\ \end{gathered} \right.$ | (2) |
式中: h为高温热害计算开始日, m为高温热害计算终止日, HDi为日有害积温, Tmaxi为日最高气温。由于水稻高温热害主要发生在抽穗、开花和灌浆乳熟期, 根据常年水稻生育期特征, 由于缺乏长时间的具体早稻生育期观测数据, 在本研究中计算高温热害不考虑具体站点的发育期, 仅从不同区域抽穗扬花灌浆的大致时间计算, 具体为:江南地区的站点高温热害计算时间从6月10日至7月10日, 华南的站点计算时间从5月21日至7月10日。
1.3 Mann-Kendall趋势检验方法采用Mann-Kendall (MK)方法分析水稻高温热害的时间趋势。MK检验是一种非参数检验方法[32], 广泛用于降水、气温、水文等方面的趋势分析和显著性检验研究[33-34]。Mann-Kendall的统计特征S值计算公式如下:
| $S = \mathop \sum \limits_{i = 1}^{n - 1} \mathop \sum \limits_{j = i + 1}^n {\text{sgn}}\left( {{x_j} - {x_i}} \right)$ | (3) |
式中: n为数据序列长度, xi、xj分别为时间i和j的值, sgn(xj-xi)为符号函数, 公式为:
| $\operatorname{sgn} ({x_j} - {x_i}) = \left\{ \begin{gathered} + 1{\text{ }}\;\;{\text{ (}}{x_j} - {x_i} > 0){\text{ }} \hfill \\ 0{\text{ }}\;\;{\text{ (}}{x_j} - {x_i} = 0) \hfill \\ - 1{\text{ }}\;\;({x_j} - {x_i} < 0) \hfill \\ \end{gathered} \right.$ | (4) |
方差计算公式为:
| ${\text{Var}}(S) = \frac{{n(n - 1)(2n + 5)}}{{72}}$ | (5) |
式中: n为数据序列长度。标准正态统计量Z值计算公式为:
| ${Z_s} = \left\{ \begin{gathered} \frac{{S - 1}}{{\sqrt {{\text{Var}}(S)} }}{\text{ (}}S > 0) \hfill \\ 0{\text{ (}}S = 0) \hfill \\ \frac{{S + 1}}{{\sqrt {{\text{Var}}(S)} }}{\text{ (}}S < 0) \hfill \\ \end{gathered} \right.$ | (6) |
式中: Zs为趋势性大小的衡量标准。Zs > 0和Zs < 0分别说明有增大趋势和减小趋势, |Zs|越大, 则趋势越明显。当给定显著性水平α后, 可在正态分布表中查得临界值Zα/2, 若|Z| > Zα/2, 即说明序列的趋势性显著。本研究选定的显著性水平α=0.05, Z/2=Z0.05/2=1.96, 所以当Zs > 1.96时表明有显著增加趋势, 当Zs < -1.96时则表明有显著减少趋势。
根据前人的相关研究表明, 直到1990年代以后南方大部夏季气温增暖才变得突出[15-16], 为了探究不同时段的时间趋势, 本研究对1971—2015年的全时段和1971—1990年、1990—2015年2个分时段的趋势分别进行了相关趋势检验。
1.4 极值概率分布函数选择与参数估计本文选择国内外广泛应用于极端气象事件的统计分布模型[35]:广义极值分布(generalized extreme value, GEV)拟合高温热害序列, 函数如下所示:
| $f({\rm{x}}) = \left\{ \begin{gathered} \frac{1}{\sigma }\exp \left[ { - {{(1 + kz)}^{ - 1/k}}} \right]{(1 + kz)^{ - 1 - 1/k}}{\text{ (}}k \ne {\text{0)}} \hfill \\ \frac{1}{\sigma }\exp \left[ { - z - {\rm{exp}}( - z)} \right]{\text{ (}}k = {\text{0)}} \hfill \\ \end{gathered} \right.$ | (7) |
式中: z=(x-μ)/σ, k、σ和μ分别为GEV分布函数的形状参数、尺度参数和位置参数。其中尺度参数σ > 0。GEV的分布范围取决于形状参数k, 不同的形状参数产生不同的极值分布类型: k=0为极值Ⅰ型, 也就是耿贝尔分布(Gumbel)分布; k > 0为极值Ⅱ型, 也就是Fréchet分布; k < 0为极值Ⅲ型, 即为逆威尔布分布(reversed Weibull)。
极值分布的不同重现期(return period)估算公式为:
| ${x_T} = \left\{ \begin{gathered} \mu - \frac{\sigma }{k}\left\{ {1 - {{\left[ { - {\rm{log}}(1 - 1/T)} \right]}^{ - k}}} \right\}{\text{ (}}k \ne 0) \hfill \\ \mu - \sigma {\rm{log}} \left[ { - {\rm{log}}(1 - 1/T)} \right]{\text{ }}\;{\text{(}}k = 0) \hfill \\ \end{gathered} \right.$ | (8) |
式中: xT为重现期的水平(return level); T为重现期, 例如10年、50年、100年。(8)式其他变量如(7)式。
参数估计方法采用极大似然法(maximum likelihood method), 同时利用Kolmogorov-Smirnov (K-S)检验法来比较数据分布形式与已知分布是否一致, 即对模拟拟合优度检验。
K-S检验方法简单介绍如下:假设待检验的理论分布为F(x), 原假设为: H0: F(x)=Fn(x), 根据样本数据计算出样本的累计频率Fn(x), 然后计算出检验统计量D=max|F(x)-Fn(x)|。若D < Dα(n) [Dα(n)为显著性水平α下, 样本量n时的K-S检验临界值, 可以通过查表获得], 则认为理论分布F(x)与样本数据的经验分布拟合较好, 在显著性水平α下, 无显著差异。所有的统计分析和概率拟合程序都由R语言(https://www.r-project.org/)编程完成。
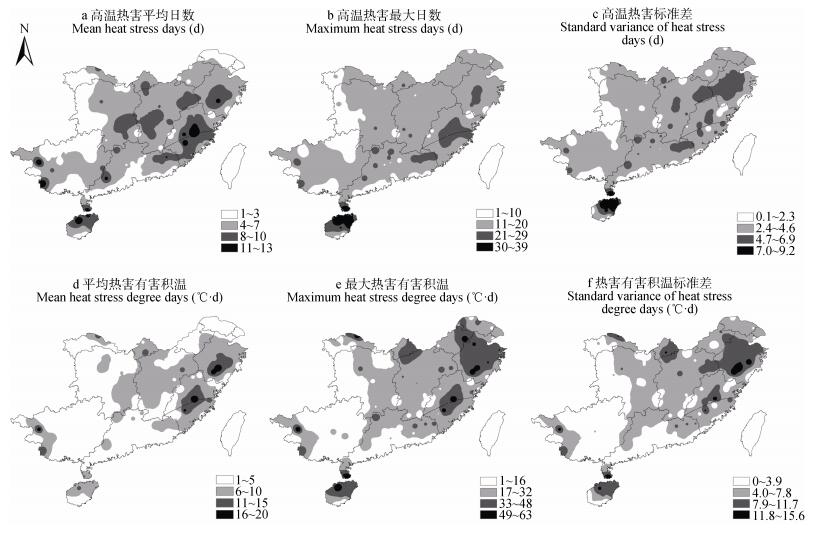
2 结果与分析 2.1 早稻高温热害时空分布和趋势特征 2.1.1 早稻高温热害的空间分布分别计算214个气象站点1971—2015年高温热害天数(ADHS)和热害有害积温(HDD), 统计每个站点的高温热害累计天数和热害有害积温的均值、最大值、标准差, 然后利用空间反距离加权方法插值得到空间分布, 结果如图 2所示。
|
图 2 早稻区域早稻高温热害累计天数和热害有害积温的均值、最大值、标准差 Figure 2 Mean, maximum, standard variance of heat stress days and heat stress degree days of early rice in the early rice area |
从图 2可知, 平均高温热害累计天数为1~13 d, 湖南西部和广西北部、广东和广西的沿海地区平均值较小, 仅1~3 d, 主要是海拔较高或者靠近海洋的缘故。高温热害累计天数平均值较大区域分布在湖南中南部、江西中部、福建和浙江中部、海南北部等地(图 2a)。高温热害累计天数最大值(图 2b)范围在1~39 d, 对比图 2 a, 均值较小的区域其最大值也较小, 最大天数主要分布在福建中部、浙江中部和海南北部, 多达30~39 d。高温热害累计天数的标准差(图 2c)也与均值和最大值的空间分布类似, 高温热害累计天数标准差较大的区域为江西中部、浙江中部、海南北部等地。
热害有害积温均值在1~20 ℃∙d(图 2d), 均值较大的区域和高温热害累计天数较大区域对应, 主要分布在浙江中部和福建中部, 其值为11~20 ℃∙d。最大热害有害积温较高区域分布在浙江、福建、江西北部、海南北部, 达33~63 ℃∙d(图 2e)。同时, 这些区域的热害有害积温标准差也较大。
由上可知, 高温热害累计天数和热害有害积温的均值、最大值、标准差的空间分布具有相似性, 两个指标反映的早稻高温热害空间分布特征具有一致性。
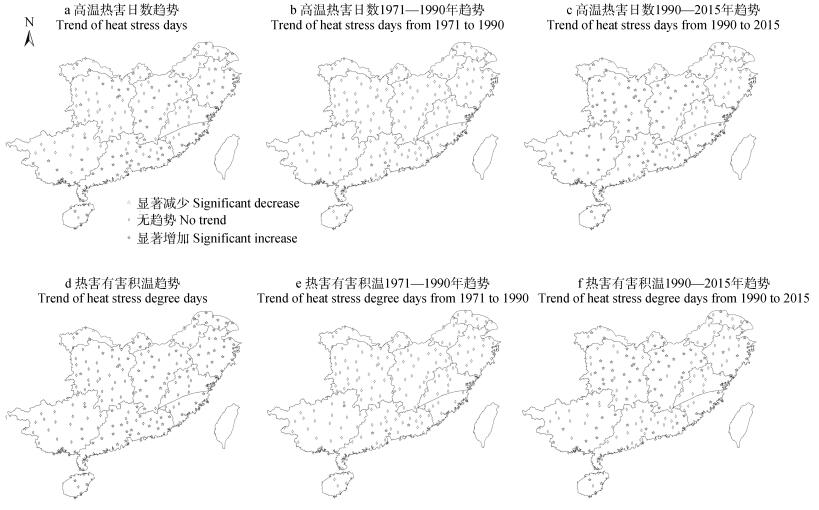
2.1.2 早稻高温热害的时间趋势图 3是利用Mann-Kendall趋势检验方法检验高温热害累计天数和热害有害积温的时间趋势。从图 3a可知, 从全时段1971—2015年看, 大部分站点的高温热害累计天数增加或减少的趋势并不明显。具有显著增加趋势的81个站点, 零散分布在江南中部和北部以及华南中部等地。同时, 大部分站点的热害有害积温也无明显的时间趋势(图 3d), 其中有88个站点的热害有害积温呈现显著增加趋势。显著增加的点空间分布和高温累计天数分布并不完全重叠。
|
图 3 1971—2015年(a, d)、1971—1990年(b, e)和1990—2015年(c, f)早稻区域早稻高温热害累计天数(a, b, c)和热害有害积温(d, e, f)Mann-kendall趋势分段趋势检验 Figure 3 Mann-Kendall tests of accumulated days of heat stress (a, b, c) and heat stress degree days (d, e, f) of early rice during 1971-2015 (a, d), 1971-1990 (b, e) and 1990-2015 (c, f) in the early rice area |
从分阶段的趋势来看, 20世纪90年代以前(图 3b, e), 大部分站点的高温热害累计天数和热害有害积温都无显著的时间趋势; 但是90年代后(图 3c, f), 超过1/2以上的站点高温热害累计天数和热害有害积温都呈显著增加趋势, 说明90年代后高温热害越来越严重。
2.2 高温热害序列的极值分布 2.2.1 最优分布根据K-S检验方法计算广义极值分布(GEV)、耿贝尔分布(Gumbel)的K-S统计值, 然后选择该站点的最优分布。表 1为214个站点最优分布的拟合统计情况, 对于高温热害累计天数(ADHS), 56个站点的最优分布是Gumbel分布, 82个站点的最优分布是GEV分布, 此外76个站点没有通过显著性检验, 即不符合GEV或者Gumbel分布, 占所有站点的36%。对于热害有害积温(HDD), 61个站点的最优分布为Gumbel分布, 58个站点的最优分布为GEV分布, 95个站点没有通过显著性检验, 占所有站点的44%。
| 表1 早稻高温热害指标时间序列的最优分布的站点数 Table 1 Number of meteorological sites with the optimal distribution models for time-serials of heat stress indices of early rice |
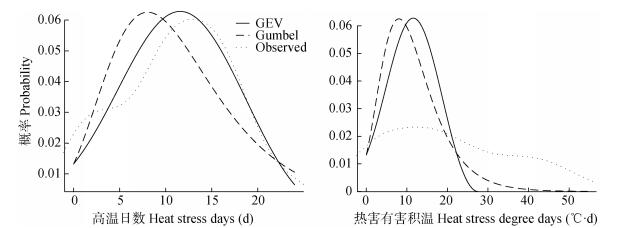
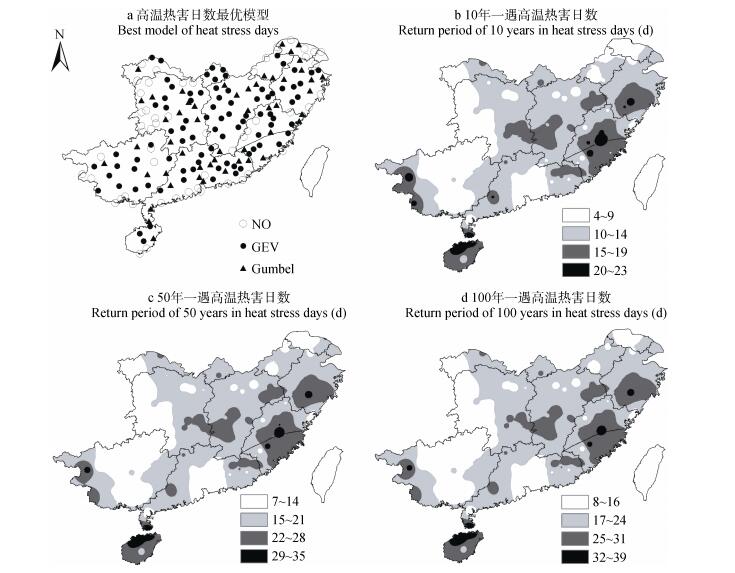
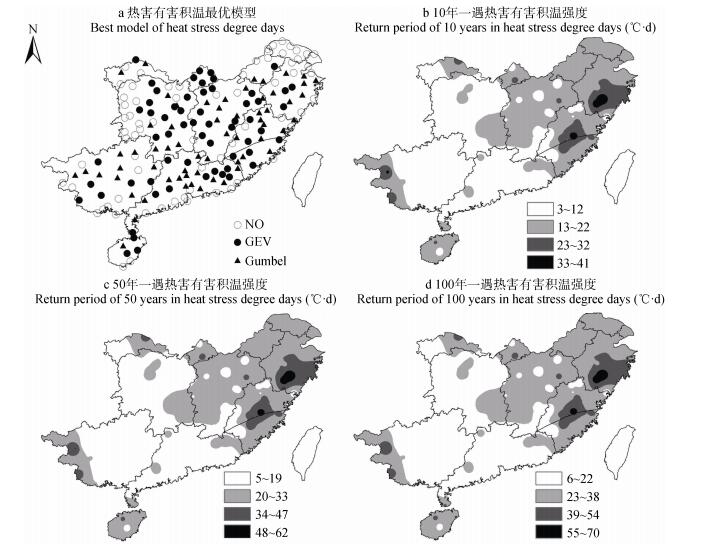
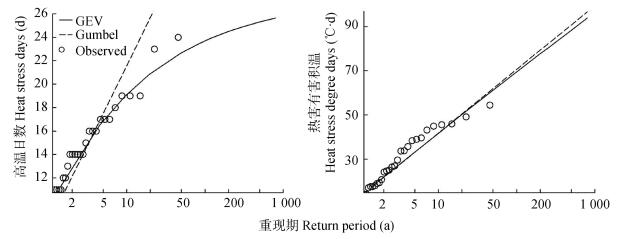
图 4给出了浙江丽水站的高温热害累计天数和热害有害积温的观测概率密度和极值分布函数的拟合曲线。从图 4可知, GEV分布很好地拟合了浙江丽水站的高温日数分布情况, 而GEV分布和Gumbel分布都没有很好地拟合热害有害积温的分布。由图 5a和图 6a给出的不同站点的最优分布情况可以看出, 不同站点的最优分布没有明显的空间分布规律。
|
图 4 浙江丽水站高温热害累计天数和热害有害积温概率密度函数和极值函数分布拟合曲线 Figure 4 Observed density and functions fitted probability of accumulated days of heat stress (ADHS) and heat stress degree days (HDD) at Lishui Station, Zhejiang Province (GEV:广义极值分布; Gumbel:耿贝尔分布; Observed:观测) (GEV: generalized extreme value; Gumbel: Gumbel distribution; Observed: observed serials) |
根据确定的各站点最优极值分布, 计算了高温热害累计天数(ADHS)和热害有害积温(HDD)在重现期水平为10年、50年、100年时的高温热害累计天数和热害有害积温(不计算没有通过显著性检验的站点), 然后通过反距离权重方法插值得到空间分布(图 5, 图 6)。
|
图 5 早稻区早稻高温热害累计天数的最优模型分布(NO:无; GEV:广义极值分布; Gumbel:耿贝尔分布)和10年、50年、100年重现期分布 Figure 5 Accumulative heat stress days of early rice according to distribution of optimal model (NO: no model; GEV: generalized extreme value; Gumbel: Gumbel distribution) and under return periods of 10, 50 and 100 years in the early rice area |
|
图 6 早稻热害有害积温的最优模型分布(NO:无; GEV:广义极值分布; Gumbel:耿贝尔分布)和10年、50年、100年重现期 Figure 6 Heat stress degree days of early rice according to distribution of optimal model (NO: no model; GEV: generalized extreme value; Gumbel: Gumbel distribution) and under return periods of 10, 50 and 100 years in the early rice area |
不同重现期水平下高温热害累计天数的分布类似(图 5)。高温热害累计天数的重现期水平较大的值集中在湖南中南部和江西中西部、浙江中部、福建中东部和海南大部地区(图 5)。这与高温热害累计天数均值的分布(图 2 a)类似。热害有害积温也有类似的规律(图 6), 不同的重现期水平下分布类似, 且与热害有害积温的均值空间分布类似(图 2 d)。高温热害累计天数和热害有害积温不同重现期水平的分布虽然不完全一致, 但趋势基本一致, 即高温热害累计天数重现期水平高的地方, 热害有害积温的重现期水平也高。
从浙江丽水站在不同极值概率分布重现期水平与观测的高温热害累计天数和热害有害积温对比可知(图 7), GEV模型估计的高温热害累计天数和观测值拟合较好, 说明GEV模型能较好地拟合浙江丽水的高温热害日数分布(图 4)。而热害有害积温的GEV和Gumbel函数无显著差异。
|
图 7 浙江丽水站在不同最优模型分布下的重现期对应的高温热害指标与观测值的对比 Figure 7 Comparisons of heat stress indices between observed values and predicted values by different probability models at Lishui Station, Zhejiang Province under different return periods (GEV:广义极值分布; Gumbel:耿贝尔分布; Observed:观测) (GEV: generalized extreme value; Gumbel: Gumbel distribution; Observed: observed serials) |
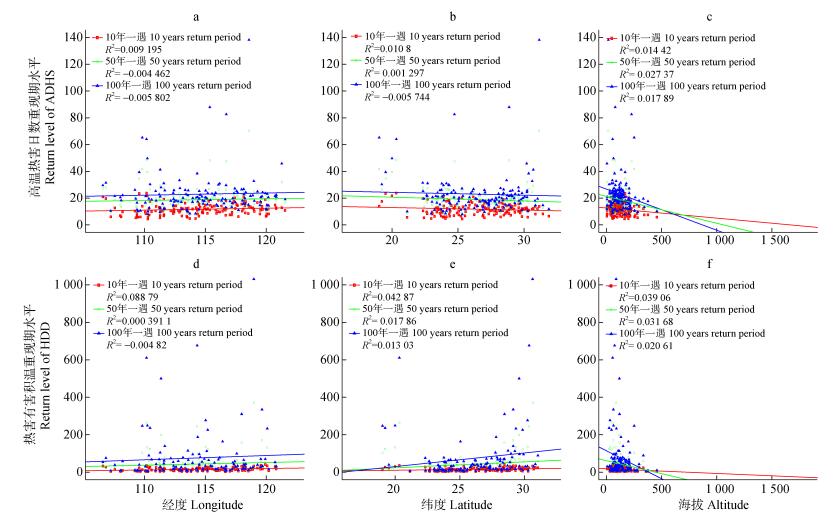
图 8为高温热害累计天数和热害有害积温的10年、50年、100年重现期水平与经度、纬度和海拔的关系。从散点图和线性拟合的R2来看, 重现期水平和经度、纬度以及海拔没有显著关系。同样, 热害有害积温的重现期水平与经度、纬度和海拔也无显著关系。
|
图 8 不同重现期下的高温热害累计天数和热害有害积温回归水平与经度、纬度和海拔的关系 Figure 8 Relationships between return level of accumulative heat stress days (ADHS), heat stress degree days (HDD) and longitude, latitude, and altitude under different return periods |
本研究的结果显示无论是高温热害累计天数(ADHS) 还是热害有害积温(HDD), 虽然大部分站点无统计显著性的增加趋势, 但依然有超过1/3的站点(分别是81个、88个站点)在1971—2015年期间有显著增加的趋势, 这和全球变暖大背景下极端温度事件增多的趋势是一致的[10-11]。Shen等[10]关于1960—2011年的中国极端气温的趋势变化研究指出超过90分位数以上的极端高温天数在过去50年增加了2.49 d。此外, 前人研究表明过去30年的高温热害趋势更加明显。Zhang等[12]的研究指出中国双季早稻的热害有害积温的趋势在过去30年区域平均增加了4.42 ℃, Shi等[2]的研究也表明过去30年高温热害累计天数平均增加了1.2 d∙(10a)-1。本研究表明中国早稻区大部分站点的高温热害未显示显著增加趋势, 究其原因:其一, 本研究选择了中国早稻区所有的国家级气象站点, 站点数较上述研究多, 有些站点可能在海拔较高的地段, 高温热害不明显; 其二, 本研究选择的时间段较先前部分研究选择的时间段长, 而高温热害增加在近20年比过去严重; 其三, Zhang等[12]和Shi等[2]的研究中, 计算高温热害均从农业气象站点入手, 详细考虑水稻发育期, 而本研究由于缺乏长时间的水稻生育期观测, 选择了固定的时间段作为统计时段, 统计时间长度超过实际敏感期, 计算出的热害天数可能会超过实际发生天数, 从而导致了趋势的差异。相比先前省际尺度的高温热害时空分布的研究结果[13, 17, 19, 36-38], 本文从全国尺度的研究也基本反映了省际尺度的时空分布规律, 高温热害主要集中在长江中下游海拔较低的区域。从分时间段的趋势统计看, 20世纪90年代以前大部分站点的高温热害无明显的时间趋势, 但是90年代后高温热害1/2以上的站点呈显著增加趋势。说明随着气候变化, 水稻高温热害潜在气候风险越来越高, 这与杨太明等[15]和朱珠等[38]相关省级的分段趋势检验相符合。
3.2 高温热害极值概率分布利用极值概率分布函数对214个站点的水稻高温热害累计天数(ADHS)、热害有害积温(HDD)拟合结果表明, 64%的站点可以用GEV或者Gumbel概率分布来描述高温热害日数的分布规律, 而对于热害有害积温, 56%的站点满足GEV或Gumbel的概率分布。这基本验证了我们在引言提出的假设, 超过1/2以上站点的水稻高温热害指标满足极值概率分布函数的规律。这说明水稻高温热害指标与极端高温[26-28]、极端降水[24-25]一样, 基本满足极值概率分布规律。
高温热害的回归周期水平反映不同高温热害风险程度。本研究结果表明, 无论是10年、50年、100年一遇的回归周期都具有明显的空间异质性, 而这种异质性基本与历史的平均高温热害风险一致(对比图 2和图 5、图 6)。这也充分说明高温热害回归周期的计算依赖于历史资料的观测。当这些极值概率风险函数应用到农业天气保险[29]时, 需要充分考虑历史资料的长度, 并不断补充更新的资料。此外, 高温热害回归周期与经度、纬度、海拔的相关关系不明显, 也侧面反映高温热害回归周期的地带性分布规律不明显。
本文仅用高温热害累计天数或者热害有害积温的极值概率分布函数来拟合早稻高温热害的概率分布特征。相比而言, 水稻高温热害不仅受到温度单因子的影响, 同时还与其他气象因子, 如降水, 也有关系, 考虑其他因子并利用多因子的联合概率分布函数(如Copula函数)[25]来揭示高温热害与其他因子的相互关系, 是将来研究需要扩展的方向。
4 结论本研究利用中国早稻种植区域214个气象站1971—2015年的数据, 结合Mann-Kendal非参数趋势检验方法和极值概率函数, 分析了早稻高温热害的时空统计特征变化规律, 得到的主要结论如下: 1)反映早稻高温热害的高温热害累计天数(ADHS)和热害有害积温(HDD)的均值在湖南中南部、江西中部、浙江和福建中部较大, 表明这些区域的早稻高温热害风险较大; 从Mann-Kenall趋势检验看, 两个指标在超过1/3的站点都呈显著增加趋势, 说明高温热害风险在这些站点显著增加, 尤其20世纪90年代以后超过1/2的站点两个指标都有显著增加的趋势。2)超过1/2站点的高温热害累计天数和热害有害积温都满足极值概率函数分布。对于高温热害累计天数(ADHS), 56个站点满足Gumbel分布, 82个站点满足GEV分布; 对于热害有害积温, 61个站点满足Gumbel分布, 58个满足GEV分布。3)两个高温热害指标的10年、50年、100年重现期的空间分布规律和两个指标均值的空间分布类似, 即均值较大的区域, 其10年、50年、100年的重现期对应的水平也较大; 重现期的水平与经度、纬度和海拔没有明显的相关关系。
| [1] |
JAGADISH S V K, MURTY M V R, QUICK W P. Rice responses to rising temperatures-Challenges, perspectives and future directions[J]. Plant, Cell & Environment, 2014, 38(9): 1686-1698. |
| [2] |
SHI P H, TANG L, WANG L H, et al. Post-heading heat stress in rice of South China during 1981-2010[J]. PLoS One, 2015, 10(6): e0130642. DOI:10.1371/journal.pone.0130642 |
| [3] |
杨舒畅, 申双和. 水稻高温热害及其风险评估的研究进展[J]. 农学学报, 2016, 6(2): 122-125. YANG S C, SHEN S H. Research progress of high temperature injury of rice and its risk accessment[J]. Journal of Agriculture, 2016, 6(2): 122-125. |
| [4] |
JAGADISH S V K, CRAUFURD P Q, WHEELER T R. High temperature stress and spikelet fertility in rice (Oryza sativa L.)[J]. Journal of Experimental Botany, 2007, 58(7): 1627-1635. DOI:10.1093/jxb/erm003 |
| [5] |
ZHANG S, TAO F L, ZHANG Z. Changes in extreme temperatures and their impacts on rice yields in southern China from 1981 to 2009[J]. Field Crops Research, 2016, 189: 43-50. DOI:10.1016/j.fcr.2016.02.008 |
| [6] |
黄义德, 曹流俭, 武立权, 等. 2003年安徽省中稻花期高温热害的调查与分析[J]. 安徽农业大学学报, 2004, 31(4): 385-388. HUANG Y D, CAO L J, WU L Q, et al. Investigation and analysis of heat damage on rice at blossoming stage in Anhui Province in 2003[J]. Journal of Anhui Agricultural University, 2004, 31(4): 385-388. DOI:10.3969/j.issn.1672-352X.2004.04.001 |
| [7] |
谢晓金, 申双和, 李映雪, 等. 高温胁迫下水稻红边特征及SPAD和LAI的监测[J]. 农业工程学报, 2010, 26(3): 183-190. XIE X J, SHEN S H, LI Y X, et al. Red edge characteristics and monitoring SPAD and LAI for rice with high temperature stress[J]. Transactions of the CSAE, 2010, 26(3): 183-190. |
| [8] |
高焕晔, 王三根, 宗学凤, 等. 灌浆结实期高温干旱复合胁迫对稻米直链淀粉及蛋白质含量的影响[J]. 中国生态农业学报, 2012, 20(1): 40-47. GAO H Y, WANG S G, ZONG X F, et al. Effects of combined high temperature and drought stress on amylose and protein contents at rice grain-filling stage[J]. Chinese Journal of Eco-Agriculture, 2012, 20(1): 40-47. |
| [9] |
YAO F M, XU Y L, LIN E D, et al. Assessing the impacts of climate change on rice yields in the main rice areas of China[J]. Climatic Change, 2007, 80(3/4): 395-409. |
| [10] |
SHEN X J, LIU B H, LU X G, et al. Spatial and temporal changes in daily temperature extremes in China during 1960-2011[J]. Theoretical and Applied Climatology, 2017, 130(3/4): 933-943. |
| [11] |
SUN Y, ZHANG X B, ZWIERS F W, et al. Rapid increase in the risk of extreme summer heat in Eastern China[J]. Nature Climate Change, 2014, 4(12): 1082-1085. DOI:10.1038/nclimate2410 |
| [12] |
ZHANG Z, WANG P, CHEN Y, et al. Global warming over 1960-2009 did increase heat stress and reduce cold stress in the major rice-planting areas across China[J]. European Journal of Agronomy, 2014, 59: 49-56. DOI:10.1016/j.eja.2014.05.008 |
| [13] |
万素琴, 陈晨, 刘志雄, 等. 气候变化背景下湖北省水稻高温热害时空分布[J]. 中国农业气象, 2009, 30(S2): 316-319. WAN S Q, CHEN C, LIU Z X, et al. Space-time distribution of heat injury on rice in Hubei Province under climate change[J]. Chinese Journal of Agrometeorology, 2009, 30(S2): 316-319. |
| [14] |
于堃, 宋静, 高苹. 江苏水稻高温热害的发生规律与特征[J]. 气象科学, 2010, 30(4): 530-533. YU K, SONG J, GAO P. Characteristics of heat damage for rice in Jiangsu Province[J]. Scientia Meteorologica Sinica, 2010, 30(4): 530-533. DOI:10.3969/j.issn.1009-0827.2010.04.016 |
| [15] |
杨太明, 陈金华, 金志凤, 等. 皖浙地区早稻高温热害发生规律及其对产量结构的影响研究[J]. 中国农学通报, 2013, 29(27): 97-104. YANG T M, CHEN J H, JIN Z F, et al. Study on the law of rice high temperature induced heat damage and its relationship with rice yield structure in Anhui and Zhejiang Province[J]. Chinese Agricultural Science Bulletin, 2013, 29(27): 97-104. |
| [16] |
谭诗琪, 申双和. 长江中下游地区近32年水稻高温热害分布规律[J]. 江苏农业科学, 2016, 44(8): 97-101. TAN S Q, SHEN S H. Distribution of high thermal damage to rice in middle and lower reaches of the Yangtze River in recent 32 years[J]. Jiangsu Agricultural Sciences, 2016, 44(8): 97-101. |
| [17] |
HUANG J, ZHANG F M, XUE Y, et al. Recent changes of rice heat stress in Jiangxi Province, southeast China[J]. International Journal of Biometeorology, 2017, 61(4): 623-633. DOI:10.1007/s00484-016-1239-3 |
| [18] |
WANG P, ZHANG Z, CHEN Y, et al. How much yield loss has been caused by extreme temperature stress to the irrigated rice production in China?[J]. Climatic Change, 2016, 134(4): 635-650. DOI:10.1007/s10584-015-1545-5 |
| [19] |
任义方, 高苹, 王春乙. 江苏高温热害对水稻的影响及成因分析[J]. 自然灾害学报, 2010, 19(5): 101-107. REN Y F, GAO P, WANG C Y. High temperature damage to paddy rice in Jiangsu Province and its cause analysis[J]. Journal of Natural Disasters, 2010, 19(5): 101-107. |
| [20] |
冯灵芝, 熊伟, 居辉, 等. RCP情景下长江中下游地区水稻生育期内高温事件的变化特征[J]. 中国农业气象, 2015, 36(4): 383-392. FENG L Z, XIONG W, JU H, et al. Changes of high temperature events during rice growth period in MLRYR under RCP Scenarios[J]. Chinese Journal of Agrometeorology, 2015, 36(4): 383-392. DOI:10.3969/j.issn.1000-6362.2015.04.002 |
| [21] |
李琪, 任景全, 王连喜. 未来气候变化情景下江苏水稻高温热害模拟研究Ⅰ:评估孕穗-抽穗期高温热害对水稻产量的影响[J]. 中国农业气象, 2014, 35(1): 91-96. LI Q, REN J Q, WANG L X. Simulation of the heat injury on rice production in Jiangsu Province under the climate change scenariosⅠ:Impact assessment of the heat injury on rice yield from booting to heading stage[J]. Chinese Journal of Agrometeorology, 2014, 35(1): 91-96. DOI:10.3969/j.issn.1000-6362.2014.01.014 |
| [22] |
王连喜, 任景全, 李琪. 未来气候变化情景下江苏水稻高温热害模拟研究Ⅱ:孕穗-抽穗期水稻对高温热害的适应性分析[J]. 中国农业气象, 2014, 35(2): 206-213. WANG L X, REN J Q, LI Q. Simulation of the heat injury on rice production in Jiangsu Province under the climate change scenarios Ⅱ:Adaptability analysis of the rice to heat injury from booting to heading stage[J]. Chinese Journal of Agrometeorology, 2014, 35(2): 206-213. DOI:10.3969/j.issn.1000-6362.2014.02.014 |
| [23] |
JIANG Z H, SONG J, LI L, et al. Extreme climate events in China:IPCC-AR4 model evaluation and projection[J]. Climatic Change, 2012, 110(1/2): 385-401. |
| [24] |
佘敦先, 夏军, 张永勇, 等. 近50年来淮河流域极端降水的时空变化及统计特征[J]. 地理学报, 2011, 66(9): 1200-1210. SHE D X, XIA J, ZHANG Y Y, et al. The trend analysis and statistical distribution of extreme rainfall events in the Huaihe River Basin in the past 50 years[J]. Acta Geographica Sinica, 2011, 66(9): 1200-1210. |
| [25] |
张强, 李剑锋, 陈晓宏, 等. 基于Copula函数的新疆极端降水概率时空变化特征[J]. 地理学报, 2011, 66(1): 3-12. ZHANG Q, LI J F, CHEN X H, et al. Spatial variability of probability distribution of extreme precipitation in Xinjiang[J]. Acta Geographica Sinica, 2011, 66(1): 3-12. |
| [26] |
程炳岩, 丁裕国, 何卷雄. 全球变暖对区域极端气温出现概率的影响[J]. 热带气象学报, 2003, 19(4): 429-435. CHENG B Y, DING Y G, HE J X. The influence of the global warming on probabilities of regional extreme temperatures[J]. Journal of Tropical Meteorology, 2003, 19(4): 429-435. DOI:10.3969/j.issn.1004-4965.2003.04.011 |
| [27] |
林晶, 陈惠, 陈家金, 等. 福建省年极端低温的分布及其参数估计[J]. 中国农业气象, 2011, 32(S1): 24-27. LIN J, CHEN H, CHEN J J, et al. The distributions of yearly minimum temperature and parameter estimation in Fujian Province[J]. Chinese Journal of Agrometeorology, 2011, 32(S1): 24-27. |
| [28] |
刘军臣, 千怀遂. 黄淮地区月极端气温概率模型[J]. 河南大学学报:自然科学版, 2000, 30(2): 84-87. LIU J C, QIAN H S. A study on the probability model of monthly extreme temperature in Huanghuai area[J]. Journal of Henan University:Natural Science, 2000, 30(2): 84-87. |
| [29] |
陈雅子, 申双和. 江苏省水稻高温热害保险的天气指数研制[J]. 江苏农业科学, 2016, 44(10): 461-464. CHEN Y Z, SHEN S H. Design of weather index of high temperature thermal damage insurance for rice in Jiangsu Province[J]. Jiangsu Agricultural Sciences, 2016, 44(10): 461-464. |
| [30] |
毛留喜, 魏丽. 大宗作物气象服务手册[M]. 北京: 气象出版社, 2015: 96-97. MAO L X, WEI L. Handbook of Meteorological Service for Staple Crops[M]. Beijing: China Meteorological Press, 2015: 96-97. |
| [31] |
武汉区域气候中心. GB/T 21985-2008主要农作物高温危害温度指标[S].北京: 中国标准出版社, 2008 Regional Climate Center of Wuhan. GB/T 21985-2008 Temperature Index of High Temperature Harm for Main Crops[S]. Beijing: China Standards Press, 2008 |
| [32] |
魏凤英. 现代气候统计诊断与预测技术[M]. 北京: 气象出版社, 2007: 69-70. WEI F Y. Modern Technology of Statistics, Diagnosis and Forecast for Climate[M]. Beijing: China Meteorological Press, 2007: 69-70. |
| [33] |
GOCIC M, TRAJKOVIC S. Analysis of changes in meteorological variables using Mann-Kendall and Sen's slope estimator statistical tests in Serbia[J]. Global and Planetary Change, 2013, 100: 172-182. DOI:10.1016/j.gloplacha.2012.10.014 |
| [34] |
MANN H B. Nonparametric tests against trend[J]. Econometrica, 1945, 13(3): 245-259. DOI:10.2307/1907187 |
| [35] |
COLES S. An Introduction to Statistical Modeling of Extreme Values[M]. London: Springer, 2001: 54-59.
|
| [36] |
陈升孛, 刘安国, 张亚杰, 等. 气候变化背景下湖北省水稻高温热害变化规律研究[J]. 气象与减灾研究, 2013, 36(2): 51-56. CHEN S B, LIU A G, ZHANG Y J, et al. Dynamic variations of heat injury on rice in Hubei Province under climate change[J]. Meteorology and Disaster Reduction Research, 2013, 36(2): 51-56. DOI:10.3969/j.issn.1007-9033.2013.02.007 |
| [37] |
何永坤, 范莉, 阳园燕. 近50年来四川盆地东部水稻高温热害发生规律研究[J]. 西南大学学报:自然科学版, 2011, 33(12): 39-43. HE Y K, FAN L, YANG Y Y. Study on the occurrence of high temperature-induced heat damage in rice in the east of Sichuan Basin in the past 50 years[J]. Journal of Southwest University:Natural Science Edition, 2011, 33(12): 39-43. |
| [38] |
朱珠, 陶福禄, 娄运生. 1980-2009年江苏省气温变化特征及水稻高温热害变化规律[J]. 江苏农业科学, 2013, 41(6): 311-315. ZHU Z, TAO F L, LOU Y S. Temperature variation characteristics and high temperature damage of rice in Jiangsu Province from 1980 to 2009[J]. Jiangsu Agricultural Sciences, 2013, 41(6): 311-315. DOI:10.3969/j.issn.1002-1302.2013.06.112 |
 2018, Vol. 26


