旱涝灾害是影响农业生产的主要气象灾害之一, 其造成的粮食损失约占我国粮食生产总损失的80%以上[1]。有关农业统计数据显示, 2015年我国因干旱和洪涝灾害所导致的受灾面积、绝收面积分别占全部受灾面积、绝收面积的74.5%、76.4%[2]。安徽省地处南北气候过渡带, 旱涝灾害频发、多发, 且一年中常出现旱涝交替、旱涝并存情况。如2003年和2007年夏季雨带位于淮河流域, 沿江江南降水偏少, 省内出现北涝南旱; 而1999年夏季沿江江南洪涝严重, 沿淮淮北却降水偏少, 出现南涝北旱[3]。旱涝灾害监测预警是农业防灾减损和保障粮食安全的重要而有效的手段之一。2017年农业农村部印发的《科学应对旱涝灾害保障粮食和农业丰收预案》就明确要求“各级农业部门要加强旱涝灾害预测预判, 及早制定完善技术方案, 及时发布预警信息, 提前落实防御措施”。
为提升农业旱涝灾害应对防御能力, 前人应用气温、降水、土壤水分等资料, 开展了大量旱涝指数相关研究与应用。在全球和区域干旱的监测和分析中应用最为广泛的是帕默尔干旱指数(Palmer drought severity index, PDSI)[4-5]和标准化降水指数(standardized precipitation index, SPI)[6], 以及基于SPI指数基础上, 通过引入潜在蒸散项构建的标准化降水蒸散指数(standardized precipitation evapotranspiration index, SPEI)[7-8]。其中PDSI物理机制较为明确, 综合考虑了水分亏缺量和持续时间对干旱程度的影响, 并考虑到土壤上下层的含水量, 但其对资料要求较高, 部分参数只能靠经验估计, 这降低了指标的适用范围[9-10]。SPI是采用Γ函数的标准化降水累积频率分布来描述降水量变化, 是表征某时段降水量出现概率的指标, 在不同地区或不同时段发生的干旱具有可比性[11]; 且计算只需要输入降水量数据, 简单易行。SPEI指数融合了SPI与PDSI指数的优点, 既具有多时间尺度的特性, 又综合了温度对干旱的影响, 很好地弥补了这两个干旱指数的不足。近年来, 国外学者青睐选取SPEI开展不同时间尺度的旱涝监测[12-13]及气候变化背景下的农业、水文等行业影响评估[14-15]。国内学者针对SPEI在中国区域的适用性及应用案例也较为多见。庄少伟等[16]分析了SPEI指数在我国不同等级降水区域的适用性, 并与SPI和湿润指数进行对比分析。刘珂等[17]使用Thornthwaite和Penman-Monteith两套潜在蒸散数据, 分别计算得到SPEI, 并以此研究了1949—2008年中国区域干湿变化时空特征以及两种蒸散数据的SPEI结果之间的差异。MING等[18]分析了中国华北平原玉米趋势产量与基于Penman-Monteith的SPEI干旱指数的相关性。李伟光等[19]、许玲燕等[20]、张勃等[21]、杨晓静等[22]应用SPEI指数分析了中国不同区域的干旱趋势与风险规律。在安徽省区域性旱涝监测评估方面, 谢五三等[23]比较了Z指数、SPI、降水距平百分率指数(precipitation anomaly percentage, PAP)、相对湿润度指数(relative humidity index, RHI)、综合气象干旱指数(comprehensive meteorological drought index, CI)等5种指标在安徽省的适用性, 其中后3个指标应用效果相对较好。马晓群等[24]以湿润度指数为基本量, 构建了综合当前旬及以前逐旬累积影响的累积湿润度指数(accumulated humidity index, AHI), 在安徽省及淮河流域开展旬尺度的旱涝监测预警方面有很强的适用性。
以上指数中, CI、AHI、SPEI等旱涝指数, 多以旬、月、季尺度的降水或降水与蒸散为基本输入, 因其简单易行, 在农业、水文等领域的旱涝识别与风险评估方面被广泛应用。但这类指数在进行旬、月、季尺度的降水累加时, 均采用逐日降水量等权累加方式, 本质上仅考虑了累计降水量而忽视了降水发生时间对当前旱涝的影响。这些指标反映的是某地月(季)尺度总体水分状况, 不能完全反映旱涝逐日变化, 当统计时段内出现明显旱涝急转情况时, 必然会出现由明显的降水移出统计窗口而导致的旱涝表征不合理问题[25-26], 从而降低指导农业生产的适用性。本文拟综合参考AHI、SPEI指数方法, 以日尺度前期累积降水蒸散差值为基本量, 采用三参数log-Logistic概率分布进行拟合, 构建日尺度的标准化前期降水蒸散指数(standardized antecedent precipitation evapotranspiration index, SAPEI), 并分析SAPEI在安徽不同干湿性气候区旱涝监测的可行性与适用性。
1 资料与方法 1.1 研究区概况与数据来源安徽省位于中国华东地区, 位于114°54′~119°37′E、29°41′~34°38′N。长江、淮河自西向东横贯省境, 将安徽省天然划分为沿淮淮北、江淮之间、沿江江南3个区域, 其中沿淮淮北属半湿润地区, 江淮及以南属湿润地区。地貌类型多样, 沿淮淮北为黄淮海平原的重要组成部分; 江淮之间以岗地为主, 其西部为大别山区; 沿江为长江中下游平原, 地势低平, 江南为皖南山区。受南北气候过渡带影响, 北方干冷气流与南方暖湿气流常在安徽省内交汇, 南北降水量差异性大, 其中沿淮淮北降水量为800~1 000 mm, 江淮之间为1 000~1 300 mm, 沿江江南为1 300~1 700 mm。在农业耕作制度上, 为水旱耕作过渡区域, 自北向南形成了旱-旱轮作、水-旱轮作、双季稻等多种轮作制度。因此选取安徽省开展旱涝指标研究与适用性分析具有代表性。
本文计算SAPEI指数所用气象数据来源于安徽省各市县地面气象观测站, 主要包括气温、降水、风速、日照等。SAPEI模型检验时所用土壤墒情数据来源于安徽省各观测站土壤墒情普查数据。进行SAPEI适用性分析时, 兼顾不同农业耕作区、不同气候干湿性区域的适用性差异检验, 在沿淮淮北选取宿州、江淮之间选取合肥、沿江江南选取宣城分别作为半湿润地区(旱作区)、半湿润与湿润过渡区(水旱轮作区)、湿润地区(双季稻区)的代表站。
1.2 SAPEI模型设计与等级指标 1.2.1 SAPEI模型设计无灌溉时, 在忽略地表径流与地下水影响时, 某日农田水分收支量(
| $ \Delta W = P - {\rm{E}}{{\rm{T}}_{\rm{m}}} $ | (1) |
式中: P为降水量; ETm为作物潜在蒸散量, 用作物系数(Kc)与参考蒸散量(ET0)乘积来估算, 即: ETm= Kc×ET0; ET0用联合国粮农组织(FAO 1998)推荐的Penman-Monteith模型计算, Kc计算方法参考文献[24]。
借鉴累积湿润度指数与前期降水指数与设计思想[24, 26], 假设当日农田水分供应能力与前期农田水分收支量有关, 且离当日越久, 影响越小, 据此构建前期累积降水与蒸散差值指数(antecedent precipitation evapotranspiration index, APEI):
| $ {\rm{APEI}} = \sum\limits_{i = 0}^m {({K^i} \times \Delta {W_i})} $ | (2) |
式中: m为前推天数, 取值100; i为前推日序数(当日为0); K为衰减系数, 取0.955;
设APEI数据序列为x={x1, x2,
| $ F(x) = {\left[ {1 + {{\left( {\frac{\alpha }{{x - y}}} \right)}^\beta }} \right]^{ - 1}} $ | (3) |
式中:
| $\beta = \frac{{2{w_1} - {w_0}}}{{6{w_1} - {w_0} - 6{w_2}}}$ | (4) |
| $ \alpha = \frac{{({w_0} - 2{w_1})\beta }}{{\mathit{\Gamma }(1 + 1/\beta )\mathit{\Gamma }(1 - 1/\beta )}} $ | (5) |
| $ \gamma = {w_0} - \alpha \mathit{\Gamma }{\rm{(1 + 1/}}\beta {\rm{)}}\mathit{\Gamma }{\rm{(1}} - {\rm{1/}}\beta {\rm{)}} $ | (6) |
| $ {w_{\rm{s}}} = \frac{1}{n}\sum\limits_{l = 1}^n {{{\left( {1 - \frac{{1 - 0.35}}{n}} \right)}^s}{x_l}} $ | (7) |
式中:
当[P≤0.5]时, 概率加权矩
| $ {\rm{SAPEI = }}w - \frac{{{c_0} + {c_1}w + {c_2}{w^2}}}{{1 + {d_1}w + {d_2}{w^2} + {d_3}{w^3}}} $ | (8) |
当[P > 0.5]时, 概率加权矩
| $ {\rm{SAPEI = }} - \left( {w - \frac{{{c_0} + {c_1}w + {c_2}{w^2}}}{{1 + {d_1}w + {d_2}{w^2} + {d_3}{w^3}}}} \right) $ | (9) |
式中:常数c0、c1、c2、d1、d2、d3同SPI计算过程, c0=2.515 517, c1=0.802 853, c2=0.010 328, d1=1.432 788, d2=0.189 269, d3=0.001 308。
1.2.2 旱涝等级划分SAPEI指数等级划分方法综合参考SPEI有关文献[21, 27]。各等级干湿类型、数值范围及理论概率见表 1。在SAPEI指数适用性分析时, 需用到土壤墒情资料, 表 1第5列为SAPEI等级对应的土壤相对湿度数值范围[28-29]。
| 表 1 标准化前期降水蒸散指数(SAPEI)等级标准、理论累积概率及相应的土壤相对湿度阈值 Table 1 Grade' standard, theoretical cumulative probability and matching soil relative humidity threshold value for standardized antecedent precipitation evapotranspiration index (SAPEI) |
作物全生育期的渍害强度与渍害所处阶段、发生次数与持续时间有关, 可用基于渍害过程的渍积指数(Qw)来表示, 即:
| $ {Q_{\rm{w}}} = \sum\nolimits_{i = 1}^n {\left[ {\sum\nolimits_{j = 1}^m {({\rm{SAPE}}{{\rm{I}}_j} - {\rm{SAPE}}{{\rm{I}}_{\rm{w}}}_0)} } \right]} $ | (10) |
式中: n为渍害过程数, m为某一渍害过程持续的天数, SAPEIj为第j天SAPEI值, SAPEIw0为涝渍害发生界限值, 取0.5。
同理, 旱积指数(Qd)可表示为:
| $ {Q_{\rm{d}}} = \sum\nolimits_{i = 1}^n {\left[ {\sum\nolimits_{j = 1}^m {({\rm{SAPE}}{{\rm{I}}_j} - {\rm{SAPE}}{{\rm{I}}_{\rm{d}}}_0)} } \right]} $ | (11) |
式中: SAPEId0为干旱发生界限值, 取-0.5。作物全省生育期气候干湿性水平, 用全生育期SAPEI平均值(SAPEI)来表示:
| $ \overline {{\rm{SAPEI}}} = \frac{1}{m} \cdot \sum\nolimits_{j = 1}^m {({\rm{SAPE}}{{\rm{I}}_j})} $ | (12) |
式中: m为全生育期天数。
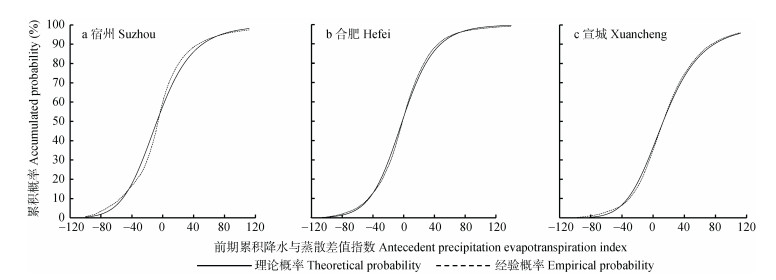
2 结果与分析 2.1 SAPEI模型检验SAPEI是假设日尺度的前期累积降水蒸散差值指数(APEI)服从log-Logistic概率分布。因此, 当日尺度的前期累积降水蒸散差值序列的经验概率分布与log-Logistic概率分布近似一致时, 即认为该尺度SAPEI分析适用于该序列。分别在淮北、江淮、沿江江南选取宿州、合肥、宣城3个代表站, 计算1961—2017年APEI序列的经验概率、三参数log-Logistic分布理论概率F(x)(图 1)。可以看出, 不同干湿性区域代表站的log- Logistic概率分布函数F(x)曲线和经验概率分布曲线重合度都很高。因此APEI序列符合三参数log-Logistic概率分布, 应用SAPEI表征由降水蒸散盈亏引发的旱涝是可行的。
|
图 1 安微省半湿润区域(a)、半湿润湿润过渡区域(b)和湿润区域(c)代表站点前期累积降水与蒸散差值指数(APEI)序列经验概率与log-Logistic理论概率分布对比 Fig. 1 Comparison between log-Logistic distribution (black line) and the empirical probability distribution (dots) for antecedent precipitation evapotranspiration index (APEI) series in representative stations for semi-humid zone (a), semi-humid and humid transitional zone (b), or humid zone (c) in Anhui Province |
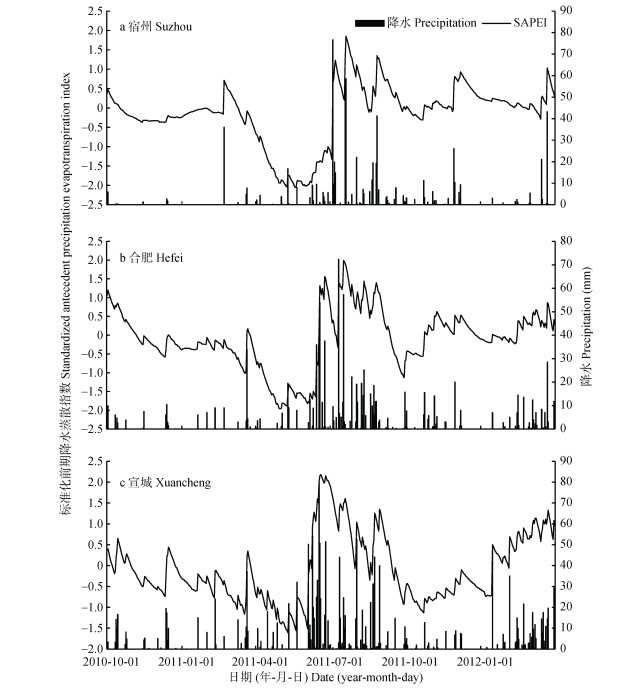
据气象监测及有关部门灾情分析, 2010年10月至2011年6月, 安徽全省大部降水持续偏少, 出现明显的秋冬春连旱, 灾情严重[30]。对淮北、沿淮、江淮3个典型区域代表站SAPEI及降水动态数据进行分析(图 2), 结果显示代表站SAPEI在无降水时呈平滑缓慢下降趋势, 没有出现SPI、CI等指标用于逐日干旱监测时常出现的“不合理旱情加剧”问题[25-26]; 且出现降水时, SAPEI均能及时响应与降水过程量相匹配的增量; 3个代表站2010—2011年度冬春季出现持续旱情, 直到6月下旬进入梅汛期才完全解除, 表征的旱情发展情况与实况基本相符。因此SAPEI能够刻画有无降水情况下的旱涝演变趋势。
|
图 2 安徽省半湿润区域(a)、半湿润湿润过渡区域(b)和湿润区域(c)代表站点2010年10月—2012年4月标准化前期降水蒸散指数(SAPEI)对降水的响应 Fig. 2 Response of standardized antecedent precipitation evapotranspiration index (SAPEI) to rainfall at representative stations for semi-humid zone (a), semi-humid and humid transitional zone (b), or humid zone (c) from Oct. 1, 2010 to Apr. 28, 2012 in Anhui Province |
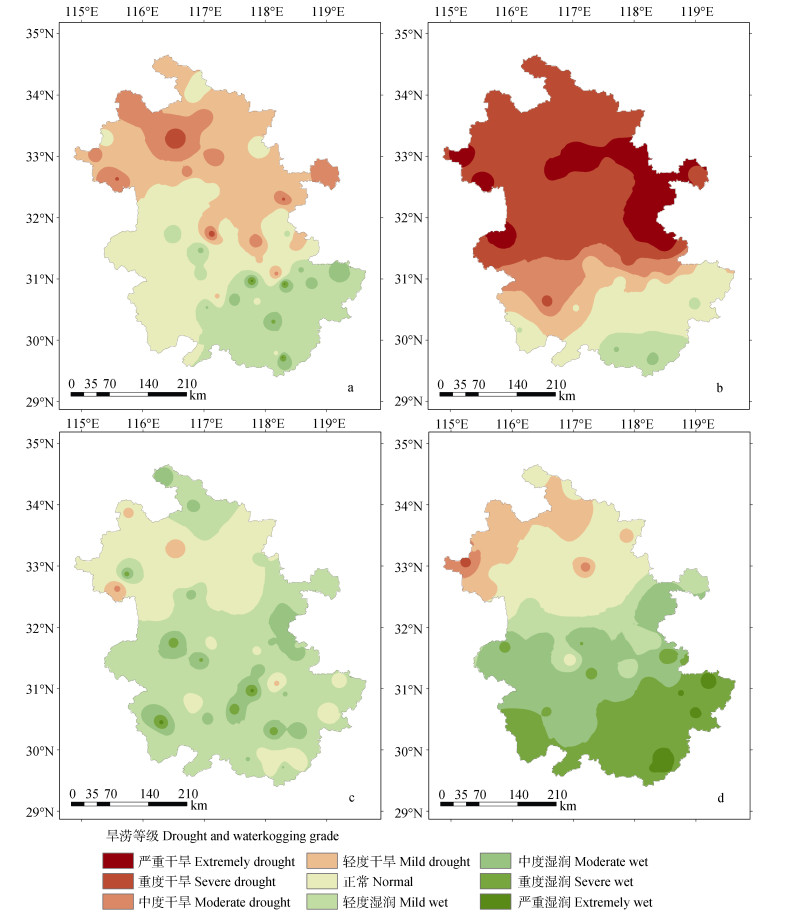
进一步对比分析2011年6月8日、6月28日旱情明显缓解前后的土壤墒情普查与SPAEI数据空间分布情况。结果显示: 6月8日土壤相对湿度与SAPEI监测数据均显示在安徽省江北大部出现不同程度旱情, 江南地区无明显旱情或一定程度的涝渍害; 6月28日两者监测数据均显示北部旱情明显缓解或解除, 南部涝渍范围明显扩大(图 3)。因此SPAEI实际应用中, 也可以较为真实地反映旱涝变化趋势。从两者对比看, 缺水情况下, SAPEI监测的干旱情况重于土壤相对湿度, 即SAPEI数据偏干; 水分有盈余时, SAPEI监测的涝渍情况重于土壤相对湿度, 即SAPEI数据偏湿。这主要是由于土壤墒情普查点有人工干预, 在干旱时不能排除前期有灌溉可能; 而在田间出现积水时, 田块三沟能及时排除多余的水分, 而SAPEI指数设计中, 当日降水没有引入剔除径流的参数。
|
图 3 安徽省2011年6月8日(旱情缓解前)、6月28日(旱情缓解后)标准化前期降水蒸散指数(SAPEI)与0~20 cm土壤相对湿度旱涝监测对比(a: 6月8日土壤墒情; b: 6月8日SAPEI; c: 6月28日土壤墒情; d: 6月28日SAPEI) Fig. 3 Comparison between standardized antecedent precipitation evapotranspiration index (SAPEI) and soil relative humidity of 0-20 cm layer on Jun. 8, 2011 (before drought relief) and Jun. 28, 2011 (after drought relief) in Anhui Province (a: soil relative humidity on Jun. 8; b: SAPEI on Jun. 8; c: soil relative humidity on Jun. 28; d: SAPEI on Jun. 28) |
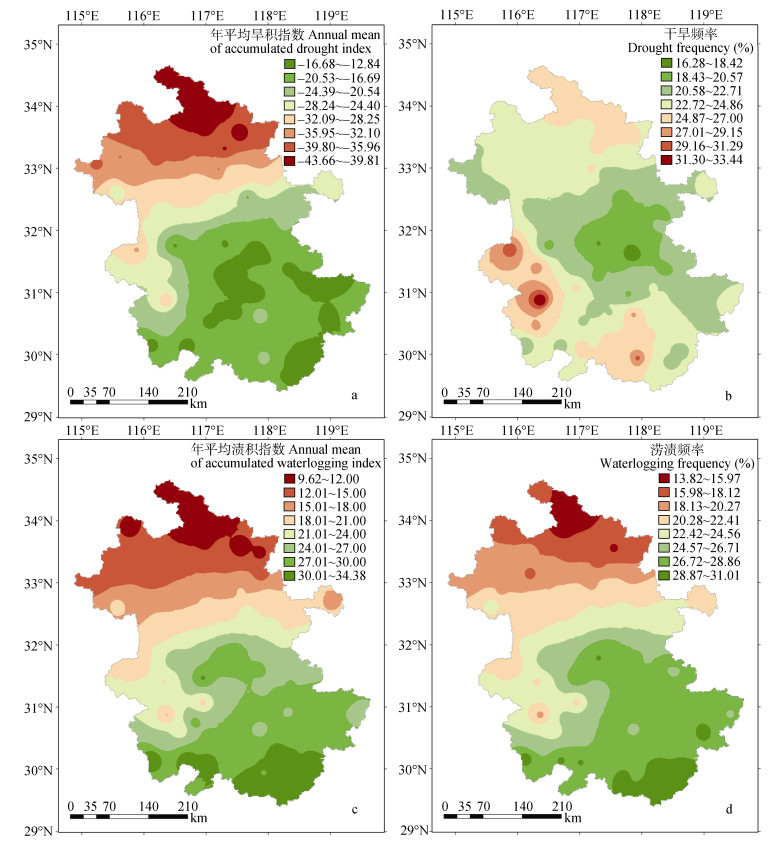
利用57 a(1961—2017年)SAPEI数据, 分别计算安徽省小麦生长季(10月21日—5月31日)的旱积指数Qd的累年平均值(Qdl)、干旱发生频率(Fd), 渍积指数Qw的累年平均值(Qwl)、涝渍发生频率(Fw)。结果显示Qdl绝对值总体呈北高南低分布, 即干旱北部重于南部, 其中沿淮淮北、大别山区旱积指数值为-45~-25不等, 江淮中东部及沿江江南地区-25~-12不等(图 4a); 其发生频率Fd全省为16%~34%不等, 大别山区、皖南山区高, 沿淮淮北次之, 江淮及沿江中东部最小(图 4b)。Qwl变化幅度为10~35, 呈北低南高分布, 即渍害南部重于北部(图 4c); 其发生频率为13%~31%不等, 北部总体低于南部地区(图 4d)。
|
图 4 安徽省冬小麦生长季旱涝积指数累年平均值及旱涝发生频率空间分布(a:年平均旱积指数; b:干旱频率; c:年平均渍积指数; d:涝渍频率) Fig. 4 Spatial distribution of drought and waterlogging frequency and annual mean of accumulated index for winter wheat in Anhui Province (a: annual mean of accumulated drought index; b: drought frequency; c: annual mean of accumulated waterlogging index; d: waterlogging frequency) |
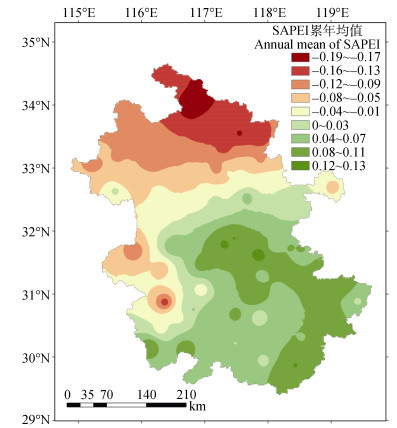
冬小麦全生育期SAPEI均值的累年平均值(ISAPEI), 反映了江淮地区多年小麦旱涝或干湿的平均状况, 其变化幅度为-0.2~0.14, 0值线为江淮分水岭偏北沿大别山区东麓、南麓走向; 0值线以北、以西为ISAPEI负值区, 属正常偏干区域, 与安徽小麦主产区基本符合; 0值线以南、以东为ISAPEI正值区, 为正常偏湿区域(图 5), 小麦种植面积自北向南逐渐减小。
|
图 5 安徽省冬小麦生育期标准化前期降水蒸散指数(SAPEI)累年平均值空间分布 Fig. 5 Spatial distribution of annual mean of standardized antecedent precipitation evapotranspiration index (SAPEI) for winter wheat whole development stage in Anhui Province |
本文选取南北过渡带、旱地水田过渡区域的安徽省为代表区域, 通过对前期降水蒸散差值加权累计量(APEI)序列进行三参数log-Logistic概率分布拟合及正态标准化处理, 构建日尺度的标准化前期降水蒸散指数(SAPEI), 并验证其在安徽不同干湿性区域的适用性。研究表明:分别代表沿淮淮北、江淮之间、沿江江南不同干湿性气候区的3个代表站点的APEI序列数据, 符合三参数log- Logistic概率分布, 经正态标准化处理后SAPEI时间序列值为锯齿状曲线, 分别在有降水时出现陡升、在无降水时缓慢下降, 其刻画出的旱涝演变趋势、旱涝等级均与土壤水分监测数据有很好的吻合性与同步性。以小麦全生育期SAPEI旱涝积指数来表示旱涝强度指标, 其累年平均值与安徽省农业旱涝气候态空间分布型一致[23-24]。全生育期SAPEI均值的累年平均值(ISAPEI)0值线沿江淮分水岭偏北、大别山区东麓、南麓走向, 0值线以北、以西的负值、偏干区域, 与安徽小麦主产区吻合。因此, 日尺度的SAPEI适用于安徽不同区域的农业旱涝实时监测预报, 且基于过程的SAPEI旱涝积指数在作物种植气候干湿性、水分适宜性评价方面也有较强实用性。
1) 与同类指数相比, SAPEI通过修改旬、月、季尺度降水蒸散序列值为日尺度的前期降水蒸散差值加权累计量, 实现旱涝指数的时间降尺度处理, 既保留了SPEI综合温度对旱涝影响及无量纲指数区域适用性强的优点, 又可反映降水发生时间、次数、日雨量大小对旱涝的影响, 避免因降水移出统计窗口而导致的旱涝表征不合理情况, 因而可以更真实地反映安徽不同干湿性区域的农田水分供需引起的逐日旱涝变化, 精准刻画日尺度的旱涝急转情况。
2) 应用基于过程的SAPEI旱涝积指数进行农业旱涝分布分析显示, 同一纬度水平下, 基于标准化前期降水蒸散指数的冬小麦全生育期旱涝频率(Fd、Fw)、累年平均旱涝积(Qdl、Qwl)及SAPEI累年平均值(ISAPEI)均在大别山区、皖南山区海拔高的区域、环巢湖区域出现低值或高值区域(图 4-图 5)。这些区域与安徽大到暴雨雨日、雨量的高低值落区[31]有很好的吻合性, 这也表明SAPEI可以反映降水过程与时间分布对旱涝的影响, 并可一定程度剔除极端强降水时的无效降水影响。而同类旬、月、季尺度指标CI、MA、SPEI指数因不能完全反映降水时间分布影响, 旱涝南北纬向分布特征更为明显, 与区域与地形因素有关的旱涝特征被弱化或忽略。可见, 基于过程的SAPEI旱涝积指数, 可以更客观、可靠地评价旱涝规律与风险分布。
3) 文中进行SAPEI与土壤相对湿度对比分析时, SAPEI表现出缺水时的旱情重于土壤相对湿度, 而田间有积水时的渍涝程度重于土壤相对湿度的两极化现象。这里有土壤墒情普查点人为干预的影响原因, 也有SAPEI指数设置时, 日降水量数据未做有效降水量处理直接参与APEI计算的原因。另一方面, 旱涝风险还与旱涝灾害所处作物生育期、持续时间长短有关。SAPEI应用于基于过程的农业影响评估时, 简单以等权旱涝积来表示旱涝过程的综合强度, 具有一定局限性。因此, 还有待结合其他有关研究与试验, 引进有效降水量或旱涝敏感性因子, 从而构建半机理性的SAPEI旱涝指数与旱涝积指数。
| [1] |
刘玲, 沙奕卓, 白月明. 中国主要农业气象灾害区域分布与减灾对策[J]. 自然灾害学报, 2003, 12(2): 92-97. LIU L, SHA Y Z, BAI Y M. Regional distribution of main agrometeorological disasters and disaster mitigation strategies in China[J]. Journal of Natural Disasters, 2003, 12(2): 92-97. DOI:10.3969/j.issn.1004-4574.2003.02.016 |
| [2] |
任晴.河南省农业旱涝防灾效率评估与提升策略研究[D].郑州: 河南理工大学, 2016 REN Q. Study on the efficiency evaluation and promotion strategy on agricultural drought and flood disaster prevention in Henan Province[D]. Zhengzhou: Henan Polytechnic University, 2016 http://cdmd.cnki.com.cn/Article/CDMD-10460-1017811723.htm |
| [3] |
杨太明, 高锷, 程文杰, 等. 安徽省粮食作物天气指数农业保险研究与实践[M]. 北京: 气象出版社, 2018. YANG T M, GAO E, CHENG W J, et al. Research and Practice on Agricultural Insurance of Grain Crop Weather Index in Anhui Province[M]. Beijing: China Meteorological Press, 2018. |
| [4] |
HEIM JR R R. A review of twentieth-century drought indices used in the United States[J]. Bulletin of the American Meteorological Society, 2002, 83(8): 1149-1165. DOI:10.1175/1520-0477-83.8.1149 |
| [5] |
HEIM JR R R. Computing the monthly Palmer Drought Index on a weekly basis:A case study comparing data estimation techniques[J]. Geophysical Research Letters, 2005, 32(6): L06401. |
| [6] |
MCKEE T B, DOESKEN N J, KLEIST J. The relationship of drought frequency and duration to time scales[C]//Proceedings of the 8th Conference on Applied Climatology. Anaheim, CA: American Meteorological Society, 1993: 179-184
|
| [7] |
VICENTE-SERRANO S M, BEGUER A S, L PEZ-MORENO J I. A multiscalar drought index sensitive to global warming:The Standardized Precipitation Evapotranspiration Index[J]. Journal of Climate, 2010, 23(7): 1696-1718. DOI:10.1175/2009JCLI2909.1 |
| [8] |
VICENTE-SERRANO S M, BEGUER A S, LORENZO-LACRUZ J, et al. Performance of drought indices for ecological, agricultural, and hydrological applications[J]. Earth Interactions, 2012, 16(10): 10. |
| [9] |
李伟光, 陈汇林, 朱乃海, 等. 标准化降水指标在海南岛干旱监测中的应用分析[J]. 中国生态农业学报, 2009, 17(1): 178-182. LI W G, CHEN H L, ZHU N H, et al. Analysis of drought monitoring on Hainan Island from standardized precipitation index[J]. Chinese Journal of Eco-Agriculture, 2009, 17(1): 178-182. |
| [10] |
王劲松, 李耀辉, 王润元, 等. 我国气象干旱研究进展评述[J]. 干旱气象, 2012, 30(4): 497-508. WANG J S, LI Y H, WANG R Y, et al. Preliminary analysis on the demand and review of progress in the field of meteorological drought research[J]. Journal of Arid Meteorology, 2012, 30(4): 497-508. |
| [11] |
袁文平, 周广胜. 标准化降水指标与Z指数在我国应用的对比分析[J]. 植物生态学报, 2004, 28(4): 523-529. YUAN W P, ZHOU G S. Comparison between standardized precipitation index and Z-index in China[J]. Acta Phytoecologica Sinica, 2004, 28(4): 523-529. DOI:10.3321/j.issn:1005-264X.2004.04.011 |
| [12] |
JARANILLA-SANCHEZ P A, WANG L, KOIKE T. Modeling the hydrologic responses of the Pampanga River basin, Philippines:A quantitative approach for identifying droughts[J]. Water Resources Research, 2011, 47(3): W03514. |
| [13] |
BEGUER A S, VICENTE-SERRANO S M, REIG F, et al. Standardized precipitation evapotranspiration index (SPEI) revisited:Parameter fitting, evapotranspiration models, tools, datasets and drought monitoring[J]. International Journal of Climatology, 2014, 34(10): 3001-3023. DOI:10.1002/joc.2014.34.issue-10 |
| [14] |
L PEZ-MORENO J I, VICENTE-SERRANO S M, ZABALZA J, et al. Hydrological response to climate variability at different time scales:A study in the Ebro basin[J]. Journal of Hydrology, 2013, 477: 175-188. DOI:10.1016/j.jhydrol.2012.11.028 |
| [15] |
HERNANDEZ E A, UDDAMERI V. Standardized precipitation evaporation index (SPEI)-based drought assessment in semi-arid south Texas[J]. Environmental Earth Sciences, 2014, 71(6): 2491-2501. DOI:10.1007/s12665-013-2897-7 |
| [16] |
庄少伟, 左洪超, 任鹏程, 等. 标准化降水蒸发指数在中国区域的应用[J]. 气候与环境研究, 2013, 18(5): 617-625. ZHUANG S W, ZUO H C, REN P C, et al. Application of standardized precipitation evapotranspiration index in China[J]. Climatic and Environmental Research, 2013, 18(5): 617-625. |
| [17] |
刘珂, 姜大膀. 基于两种潜在蒸散发算法的SPEI对中国干湿变化的分析[J]. 大气科学, 2015, 39(1): 23-36. LIU K, JIANG D B. Analysis of dryness/wetness over China using standardized precipitation evapotranspiration index based on two evapotranspiration algorithms[J]. Chinese Journal of Atmospheric Sciences, 2015, 39(1): 23-36. |
| [18] |
MING B, GUO Y Q, TAO H B, et al. SPEIPM-based research on drought impact on maize yield in North China Plain[J]. Journal of Integrative Agriculture, 2015, 14(4): 660-669. DOI:10.1016/S2095-3119(14)60778-4 |
| [19] |
李伟光, 易雪, 侯美亭, 等. 基于标准化降水蒸散指数的中国干旱趋势研究[J]. 中国生态农业学报, 2012, 20(5): 643-649. LI W G, YI X, HOU M T, et al. Standardized precipitation evapotranspiration index shows drought trends in China[J]. Chinese Journal of Eco-Agriculture, 2012, 20(5): 643-649. |
| [20] |
许玲燕, 王慧敏, 段琪彩, 等. 基于SPEI的云南省夏玉米生长季干旱时空特征分析[J]. 资源科学, 2013, 35(5): 1024-1034. XU L Y, WANG H M, DUAN Q C, et al. The temporal and spatial distribution of droughts during summer corn growth in Yunnan Province based on SPEI[J]. Resources Science, 2013, 35(5): 1024-1034. |
| [21] |
张勃, 张耀宗, 任培贵, 等. 基于SPEI法的陇东地区近50a干旱化时空特征分析[J]. 地理科学, 2015, 35(8): 999-1006. ZHANG B, ZHANG Y Z, REN P G, et al. Analysis of drought spatial-temporal characteristics based on SPEI in eastern region of Gansu in recent 50 years[J]. Scientia Geographica Sinica, 2015, 35(8): 999-1006. |
| [22] |
杨晓静, 徐宗学, 左德鹏, 等. 东北三省农业旱灾风险评估研究[J]. 地理学报, 2018, 73(7): 1324-1337. YANG X J, XU Z X, ZUO D P, et al. Assessment on the risk of agricultural drought disaster in the Three Provinces of Northeast China[J]. Acta Geographica Sinica, 2018, 73(7): 1324-1337. |
| [23] |
谢五三, 田红. 五种干旱指标在安徽省应用研究[J]. 气象, 2011, 37(4): 503-507. XIE W S, TIAN H. Study on the application of five drought indexes in Anhui Province[J]. Meteorological Monthly, 2011, 37(4): 503-507. |
| [24] |
马晓群, 吴文玉, 张辉. 利用累积湿润指数分析江淮地区农业旱涝时空变化[J]. 资源科学, 2008, 30(3): 371-377. MA X Q, WU W Y, ZHANG H. Analyzing spatial and temporal variations of agricultural drought and waterlog in Jianghuai Area through Accumulated Humidity Index[J]. Resources Science, 2008, 30(3): 371-377. DOI:10.3321/j.issn:1007-7588.2008.03.008 |
| [25] |
杨丽慧, 高建芸, 苏汝波, 等. 改进的综合气象干旱指数在福建省的适用性分析[J]. 中国农业气象, 2012, 33(4): 603-608. YANG L H, GAO J Y, SU R B, et al. Analysis on the suitability of improved comprehensive meteorological drought index in Fujian Province[J]. Chinese Journal of Agrometeorology, 2012, 33(4): 603-608. DOI:10.3969/j.issn.1000-6362.2012.04.019 |
| [26] |
王春林, 陈慧华, 唐力生, 等. 基于前期降水指数的气象干旱指标及其应用[J]. 气候变化研究进展, 2012, 8(3): 157-163. WANG C L, CHEN H H, TANG L S, et al. A daily meteorological drought indicator based on standardized antecedent precipitation index and its spatial-temporal variation[J]. Progressus Inquisitiones de Mutatione Climatis, 2012, 8(3): 157-163. DOI:10.3969/j.issn.1673-1719.2012.03.001 |
| [27] |
MIAH M G, ABDULLAH H M, JEONG C. Exploring standardized precipitation evapotranspiration index for drought assessment in Bangladesh[J]. Environmental Monitoring and Assessment, 2017, 189(11): 547. DOI:10.1007/s10661-017-6235-5 |
| [28] |
薛建军, 赵琳娜, 齐丹, 等. GB/T 32752-2016农田渍涝气象等级[S].北京: 中国标准出版社, 2017 XUE J J, ZHAO L N, QI D, et al. GB/T 32752-2016 Meteorological Grade of Agricultural Waterlogging[S]. Beijing: China Standard Press, 2017 |
| [29] |
吕厚荃, 张玉书, 李茂松, 等. GB/T 32136-2015农业干旱等级[S].北京: 中国标准出版社, 2016 LYU H Q, ZHANG Y S, LI M S, et al. GB/T 32136-2015 Grade of Agricultural Drought[S]. Beijing: China Standard Press, 2016 |
| [30] |
刘建刚. 2011年长江中下游干旱与历史干旱对比分析[J]. 中国防汛抗旱, 2017, 27(4): 46-50. LIU J G. A Comparative analysis of current severe drought in the Middle and Lower Reaches of Yangtze River 2011 with historical drought records[J]. China Flood & Drought Management, 2017, 27(4): 46-50. DOI:10.3969/j.issn.1673-9264.2017.04.013 |
| [31] |
童金, 魏凌翔, 张娇, 等. 安徽省春季暴雨气候特征统计分析[J]. 暴雨灾害, 2016, 35(6): 504-510. TONG J, WEI L X, ZHANG J, et al. Statistical analysis of climatological characteristics of spring rainstorm in Anhui Province[J]. Torrential Rain and Disasters, 2016, 35(6): 504-510. DOI:10.3969/j.issn.1004-9045.2016.06.002 |
 2019, Vol. 27


